Solaris Off-CPU Flame Graphs

Performance issues can be categorized into one of two types:
- On-CPU: where busy processes and threads are spending time running on-CPU.
- Off-CPU: where time is spent waiting while blocked on I/O, locks, timers, paging/swapping, etc.
On-CPU performance issues can solved using CPU Flame Graphs. That leaves off-CPU issues: the time spent by processes and threads when they are not running on-CPU. If this time is spent during an application request, synchronously, then it directly and proportionally affects performance.
Note: This page was last updated in 2014 and is no longer maintained. It is now part of my Crypt, and kept here for reference. The new Linux version is here.
I've previously proposed and documented the analysis of this off-CPU time as its own performance methodology: Off-CPU Analysis. On this page, I'll explore this and related types of analysis using Flame Graphs.
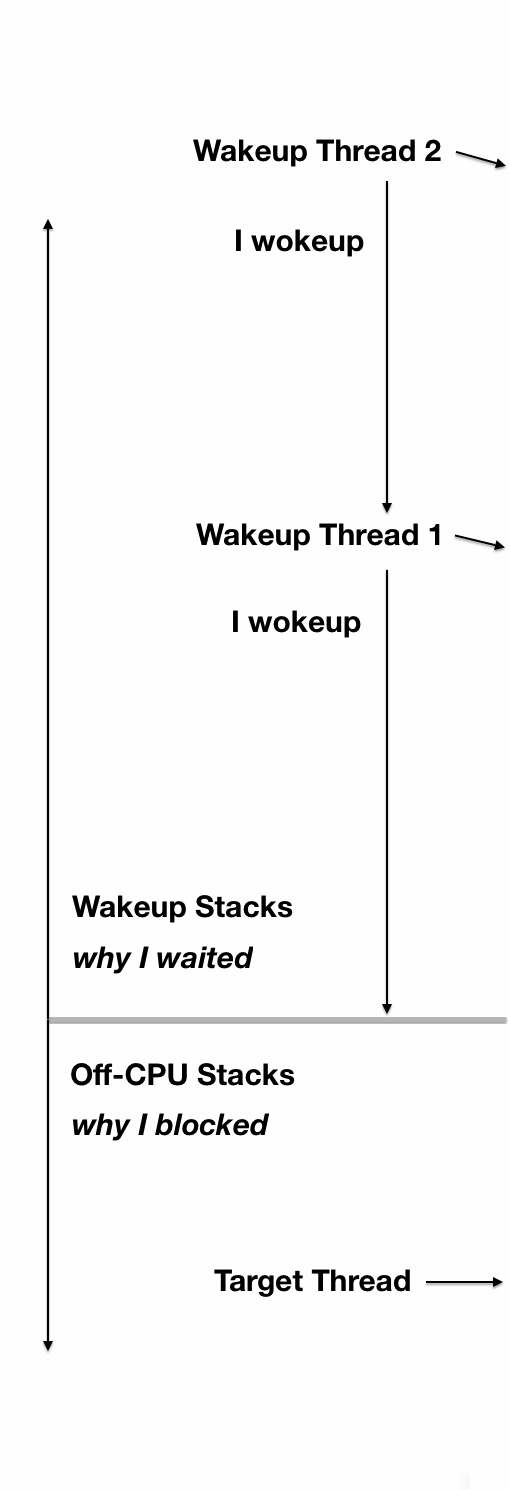
Figure 1 illustrates off-CPU time, showing an application thread which blocks during a system call. This system call is called synchronously during an application request (eg, for file system reads). Around 60% of the application request time is blocked off-CPU during this system call – time that won't be visible when only profiling on-CPU time.
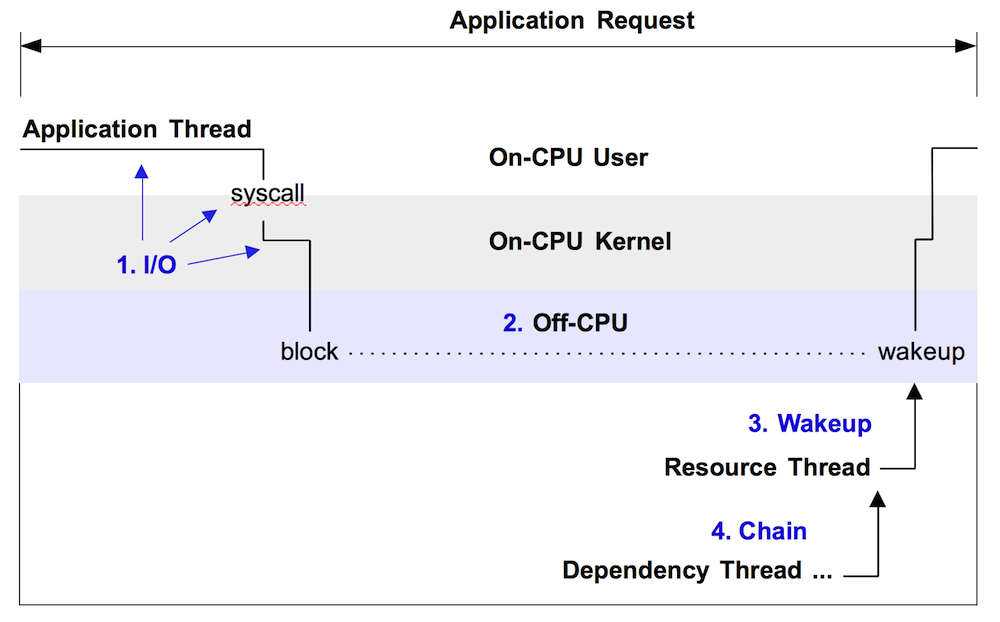
Figure 1. Example off-CPU event, with enumerated approaches for analysis.
Note that this only shows one form of off-CPU time. Applications can also spend time off-CPU due to involuntary context switching (time sharing), memory mapped disk I/O, and dispatcher queue latency. These may not involve a system call.
There are at least four different approaches for analyzing this with flame graphs, enumerated in the figure and explained in the sections that follow. These should be read in-order, as each section provides background for the next. These were also summarized in the later part of my USENIX/LISA13 talk.
DTrace is used as an example profiler on this page. As with the CPU Flame Graphs, other profilers can be used, such as SystemTap, perf, and ktap for Linux, provided they can collect the equivalent data: event timing and stack traces.
1. I/O
Kernels usually provide facilities for tracing I/O types, such as disk I/O or I/O related system calls. Since I/O is usually mostly off-CPU time, this is a form of off-CPU analysis. Bear in mind that some I/O may not leave the CPU, for example, file system cache hits. To generate a flame graph, the tracing facility needs to capture the I/O time and the stack trace or code-path that led to the I/O.
Pay attention to the I/O context, whether it is synchronous to the application request or not. If it is synchronous, then I/O latency causes direct application latency, and the resulting flame graph is a direct measure of performance. An example of this is where an application performs (blocking) file system reads, which block on disk I/O. Asynchronous I/O may or may not affect the application, or may but in an indirect way. An example of this is a file system which buffers writes and flushes them to disk later. The eventual I/O and their latency may be high, but not endured directly by the application.
As an example of I/O tracing, the following DTrace script (zfsustacks.d) traces common ZFS file system operations (including I/O), along with the operation time and the user-level stack trace:
#!/usr/sbin/dtrace -s

#pragma D option quiet
#pragma D option ustackframes=100

fbt::zfs_read:entry, fbt::zfs_write:entry, fbt::zfs_readdir:entry,
fbt::zfs_getattr:entry, fbt::zfs_setattr:entry
{
	self->start = timestamp;
}

fbt::zfs_read:return, fbt::zfs_write:return, fbt::zfs_readdir:return,
fbt::zfs_getattr:return, fbt::zfs_setattr:return
/self->start/
{
	this->time = timestamp - self->start;
	@[ustack(), execname] = sum(this->time);
	self->start = 0;
}

dtrace:::END
{
	printa("%k%s\n%@d\n", @);
}
This script performs tracing of logical I/O in kernel context at the VFS/ZFS interface (eg, zfs_read(), zfs_write(), ...). These functions are called from the syscall interface, which is synchronous to the application. (You'll need some kernel-internals knowledge to make such connections on your own.) This means that the latency measured will be suffered by the application; whether it slows an application request depends on the application logic.
The output of the script includes user-level stacks, the process name (all processes are traced), and the sum of I/O latency for each stack. Here are the steps for running this script for ten seconds, then creating a flame graph:
# ./zfsustacks.d -n 'tick-10s { exit(0); }' -o out.iostacks

# stackcollapse.pl out.iostacks | awk '{ print $1, $2 / 1000000 }' | \
    flamegraph.pl --title="FS I/O Time Flame Graph" --color=io \
    --countname=ms --width=500 > out.iostacks.svg
Mouse over elements for details (if the SVG doesn't work in your browser, try the PNG):
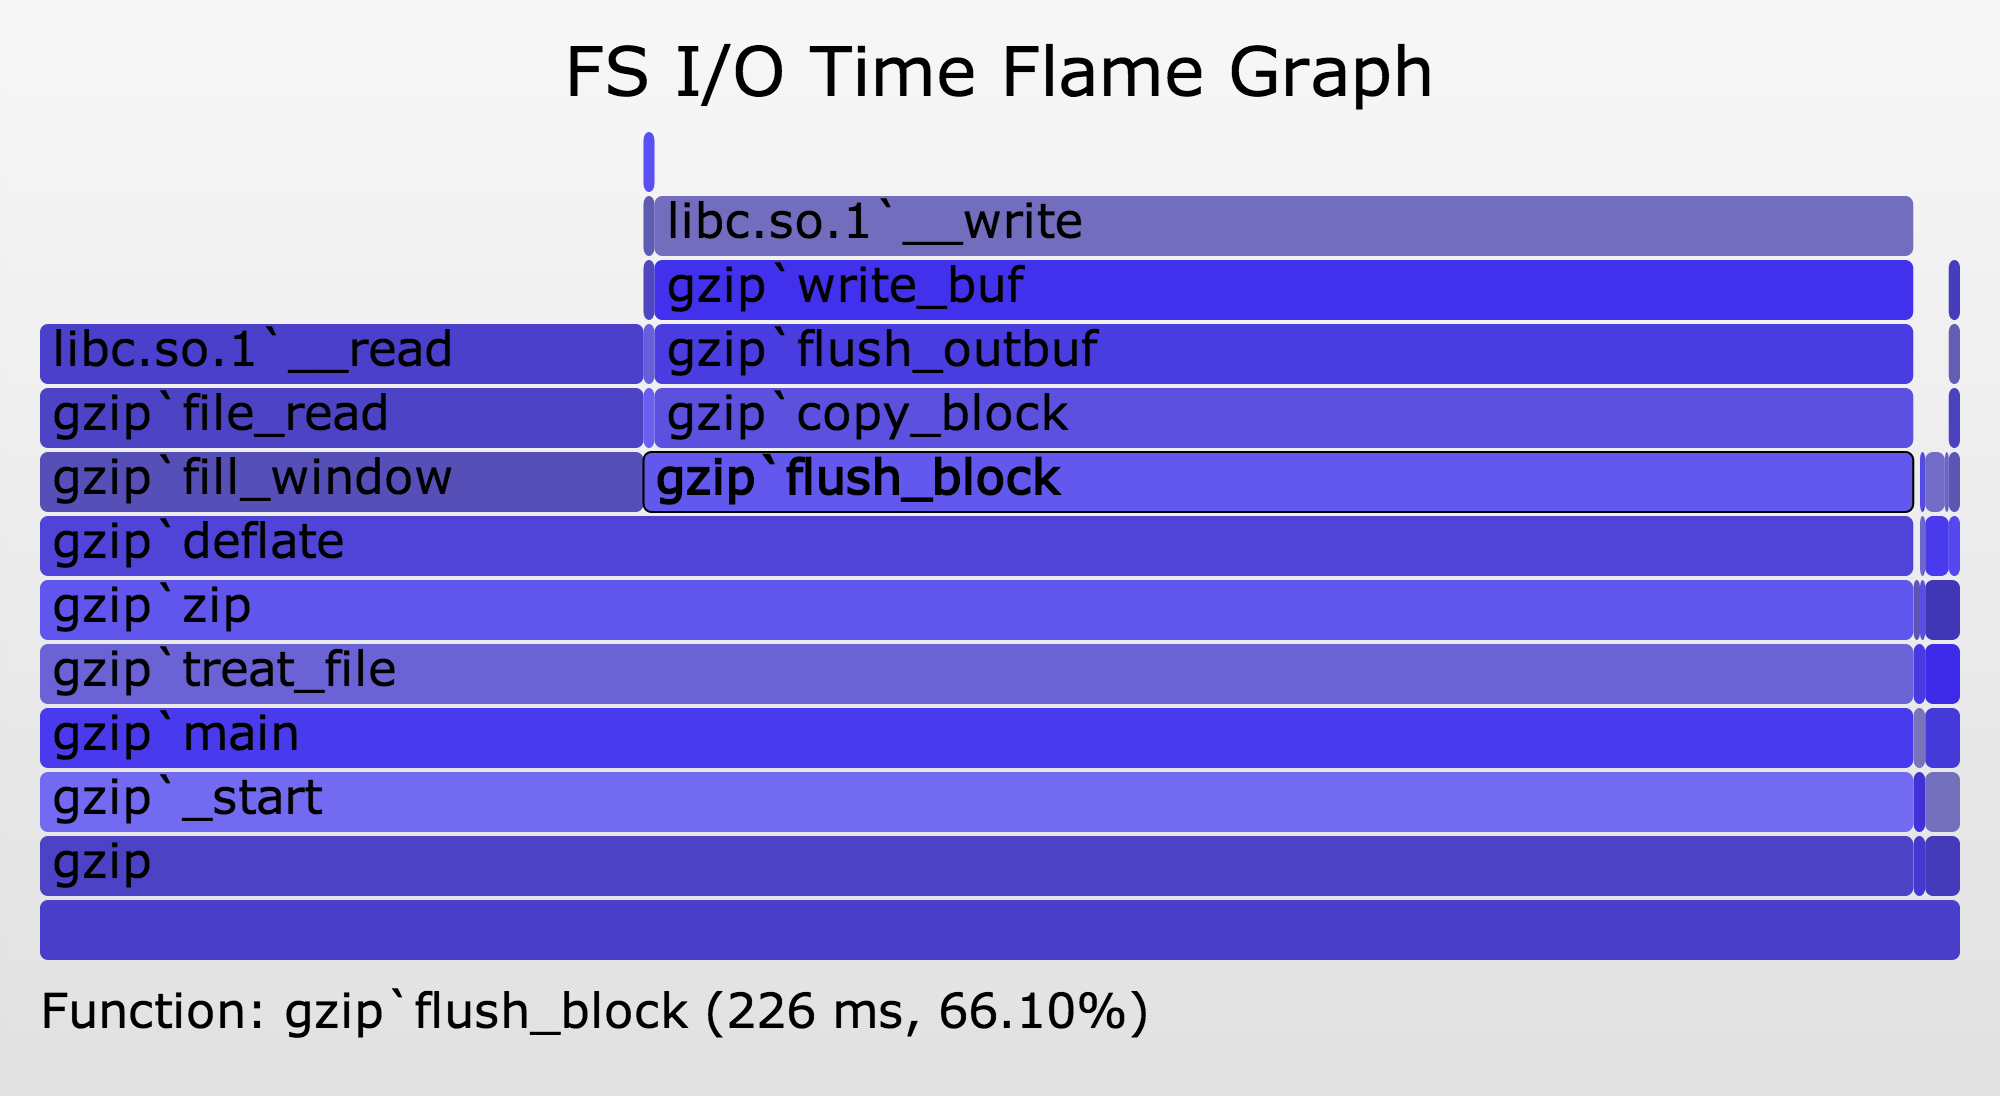
This example shows file system I/O latency while gzip(1) was compressing a file. From the flame graph it's clear that gzip spends more time waiting on writing the new compressed file, than it does reading the input file.
Flame graphs are more useful when there are many code-paths that call I/O, such as browsing the profile data as text becomes cumbersome.
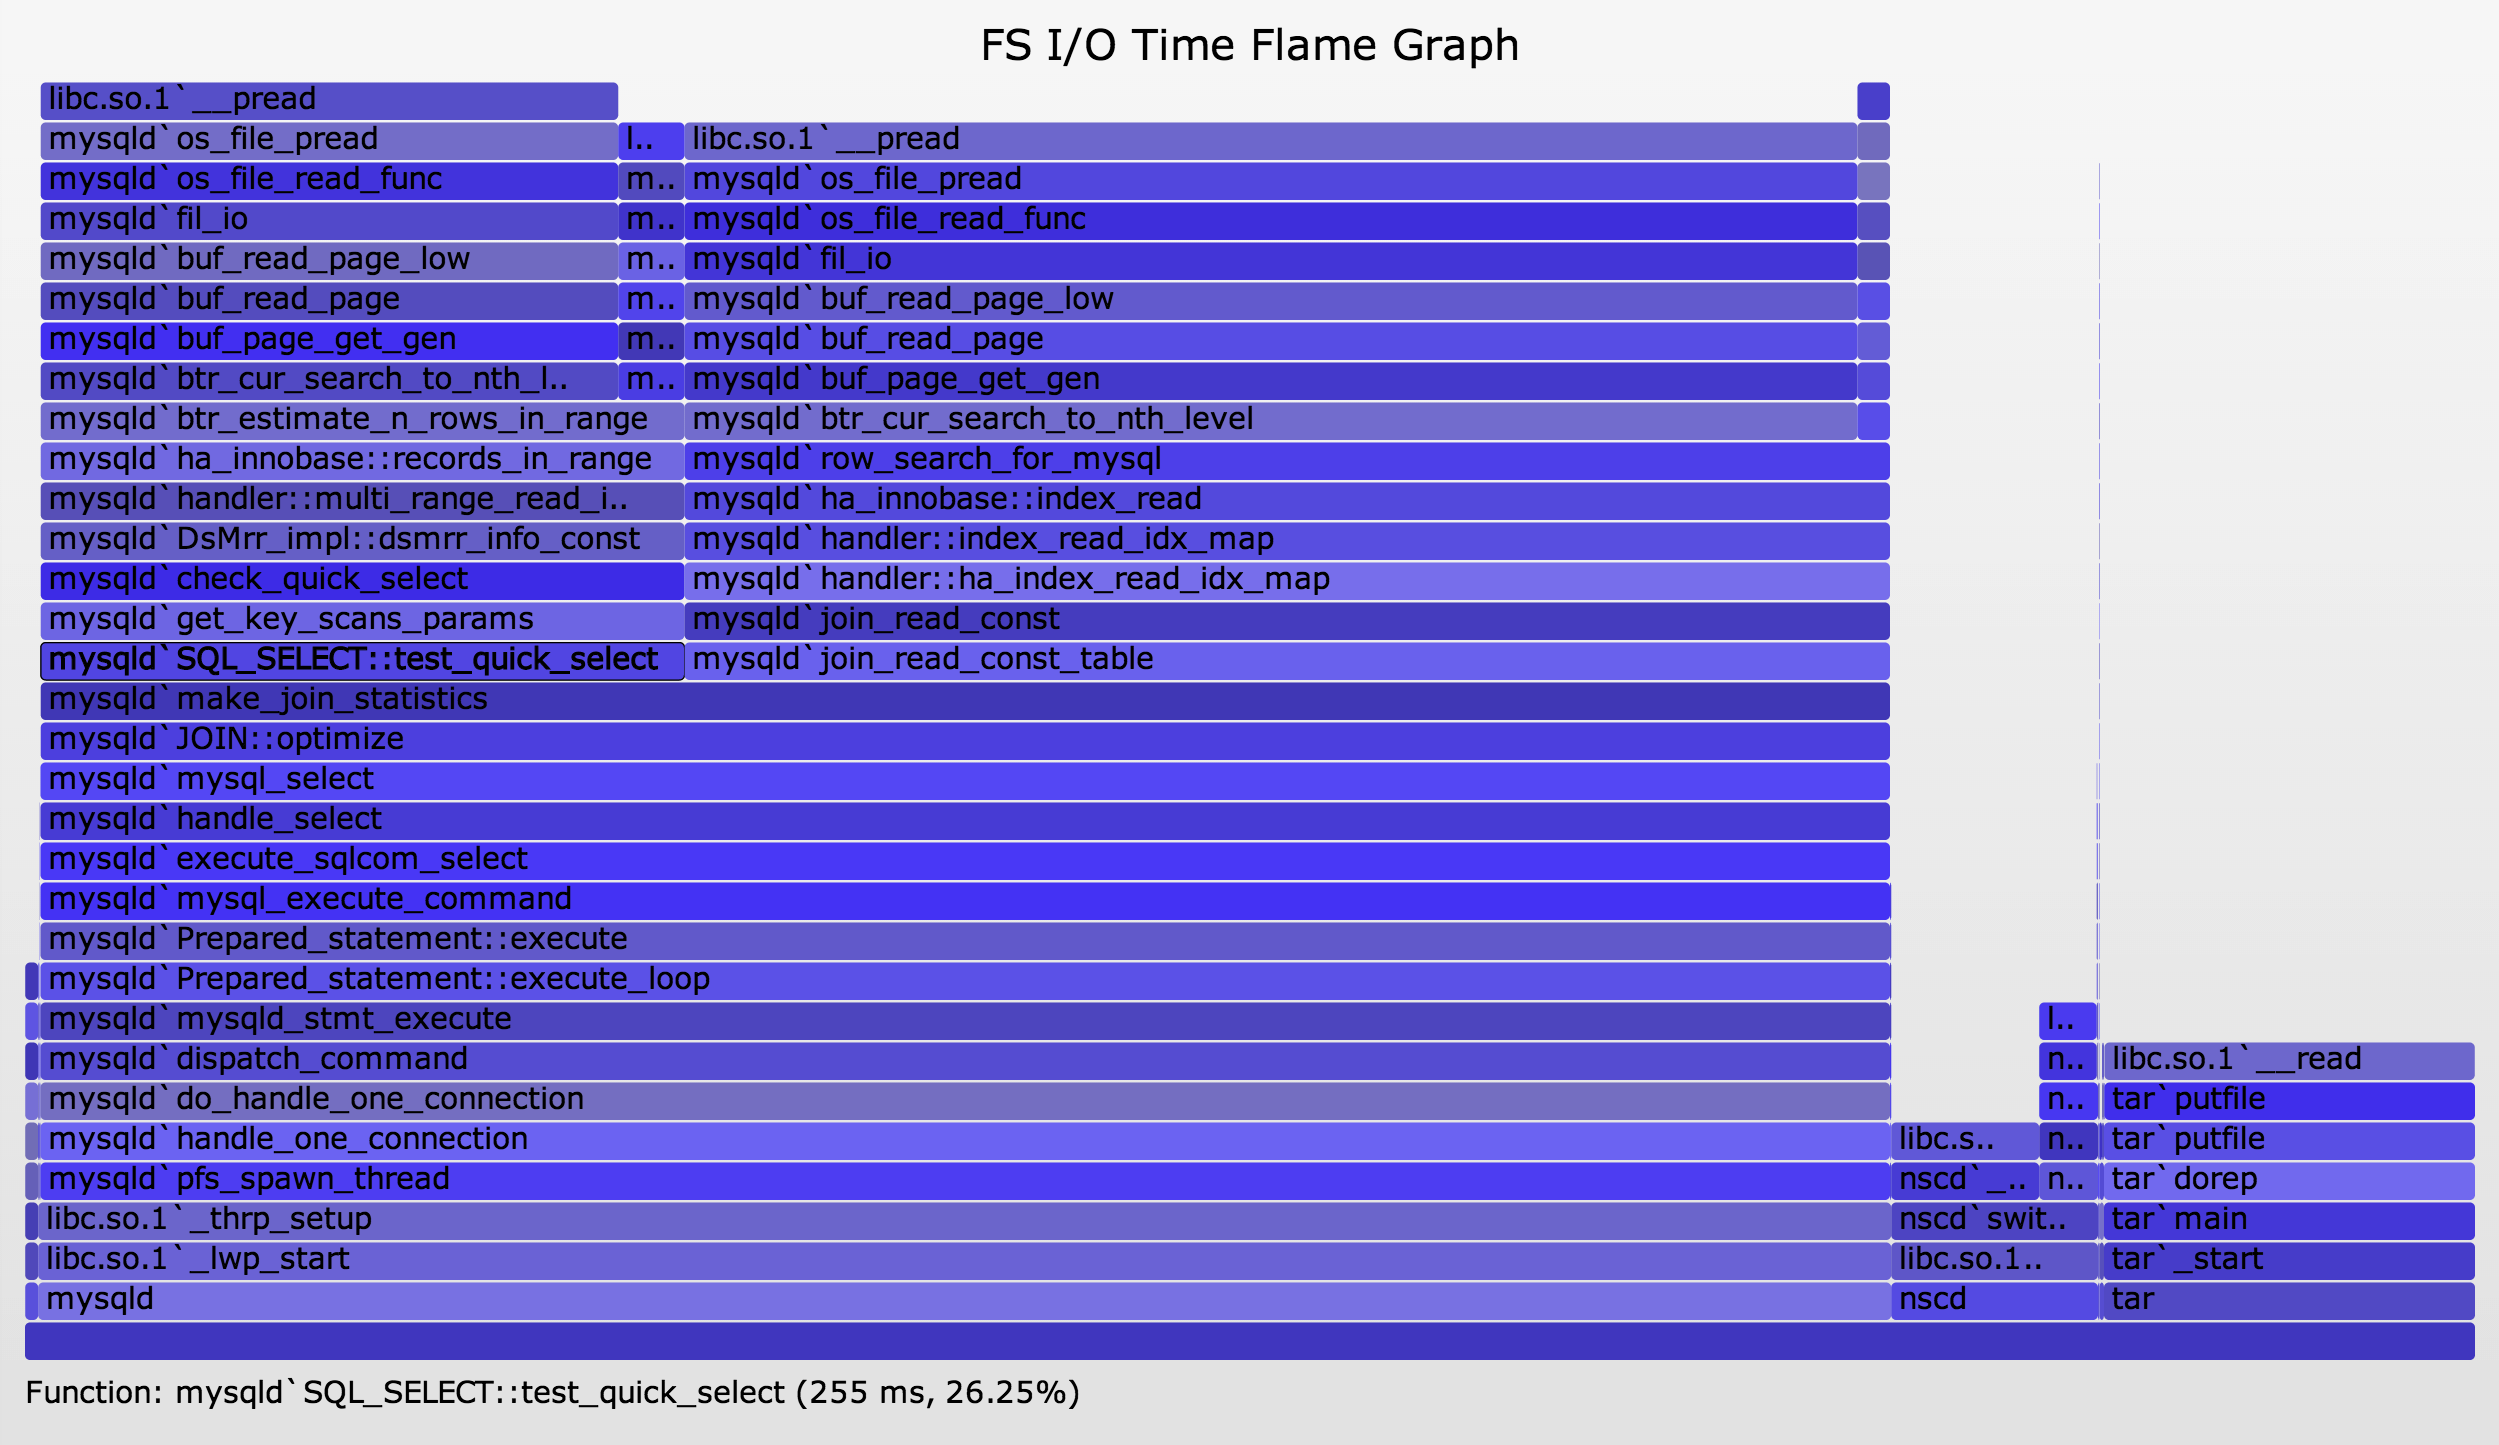
Here's another example, this time capturing both a MySQL server and a tar command (SVG, PNG):
The width of each frame is proportional to the total time spent in file system I/O (including cache hits).
There are many other targets for I/O tracing, and your kernel may have a variety of interfaces for tracing them. This can get a little cumbersome. Instead of focusing on I/O, you can focus on off-CPU events to capture all types of blocking I/O.
2. Off-CPU
This is a generic approach for analyzing all off-CPU events, including I/O, and is an advanced performance methodology. It's also the counterpart to on-CPU analysis, as is performed by using CPU Flame Graphs.
For off-CPU time flame graphs, measure the time threads spend off-CPU, along with stack traces or code-paths.
Yichun Zhang (agentzh) created these, and gave a great presentation (PDF) about them, with examples of their use on Nginx.
Here is an example of off-CPU profiling for the bash shell, using DTrace:
# dtrace -x ustackframes=100 -n '
    sched:::off-cpu /execname == "bash"/ { self->ts = timestamp; }
    sched:::on-cpu /self->ts/ {
    @[ustack()] = sum(timestamp - self->ts); self->ts = 0; }
    tick-30s { exit(0); }' -o out.offcpu
This traces the scheduler, storing a timestamp when a thread moves off-CPU, and then calculating the elapsed time when it moves back on, summing that time with the user-level stack. Note: these scheduler events can be very frequent depending on your application and its rate of I/O, and, depending on the profiler, the overhead for instrumenting each of these events can begin to be noticable.
The output from this command is saved to a file, which contains:
# cat out.offcpu
[...]
              libc.so.1`__waitid+0x15
              libc.so.1`waitpid+0x65
              bash`waitchld+0x87
              bash`wait_for+0x2ce
              bash`execute_command_internal+0x1758
              bash`execute_command+0x45
              bash`reader_loop+0x240
              bash`main+0xaff
              bash`_start+0x83
       1193160644

              libc.so.1`__read+0x15
              bash`rl_getc+0x2b
              bash`rl_read_key+0x22d
              bash`readline_internal_char+0x113
              bash`readline+0x49
              bash`yy_readline_get+0x52
              bash`shell_getc+0xe1
              bash`read_token+0x6f
              bash`yyparse+0x4b9
              bash`parse_command+0x67
              bash`read_command+0x52
              bash`reader_loop+0xa5
              bash`main+0xaff
              bash`_start+0x83
      12588900307
These are user-level stacks along with total time, in nanoseconds, off-CPU. A flame graph can then be created from this output using:
# stackcollapse.pl < out.offcpu | awk '{ print $1, $2 / 1000000 }' | \
    flamegraph.pl --title="Off-CPU Time Flame Graph" --color=io \
    --countname=ms --width=600 > out.offcpu.svg
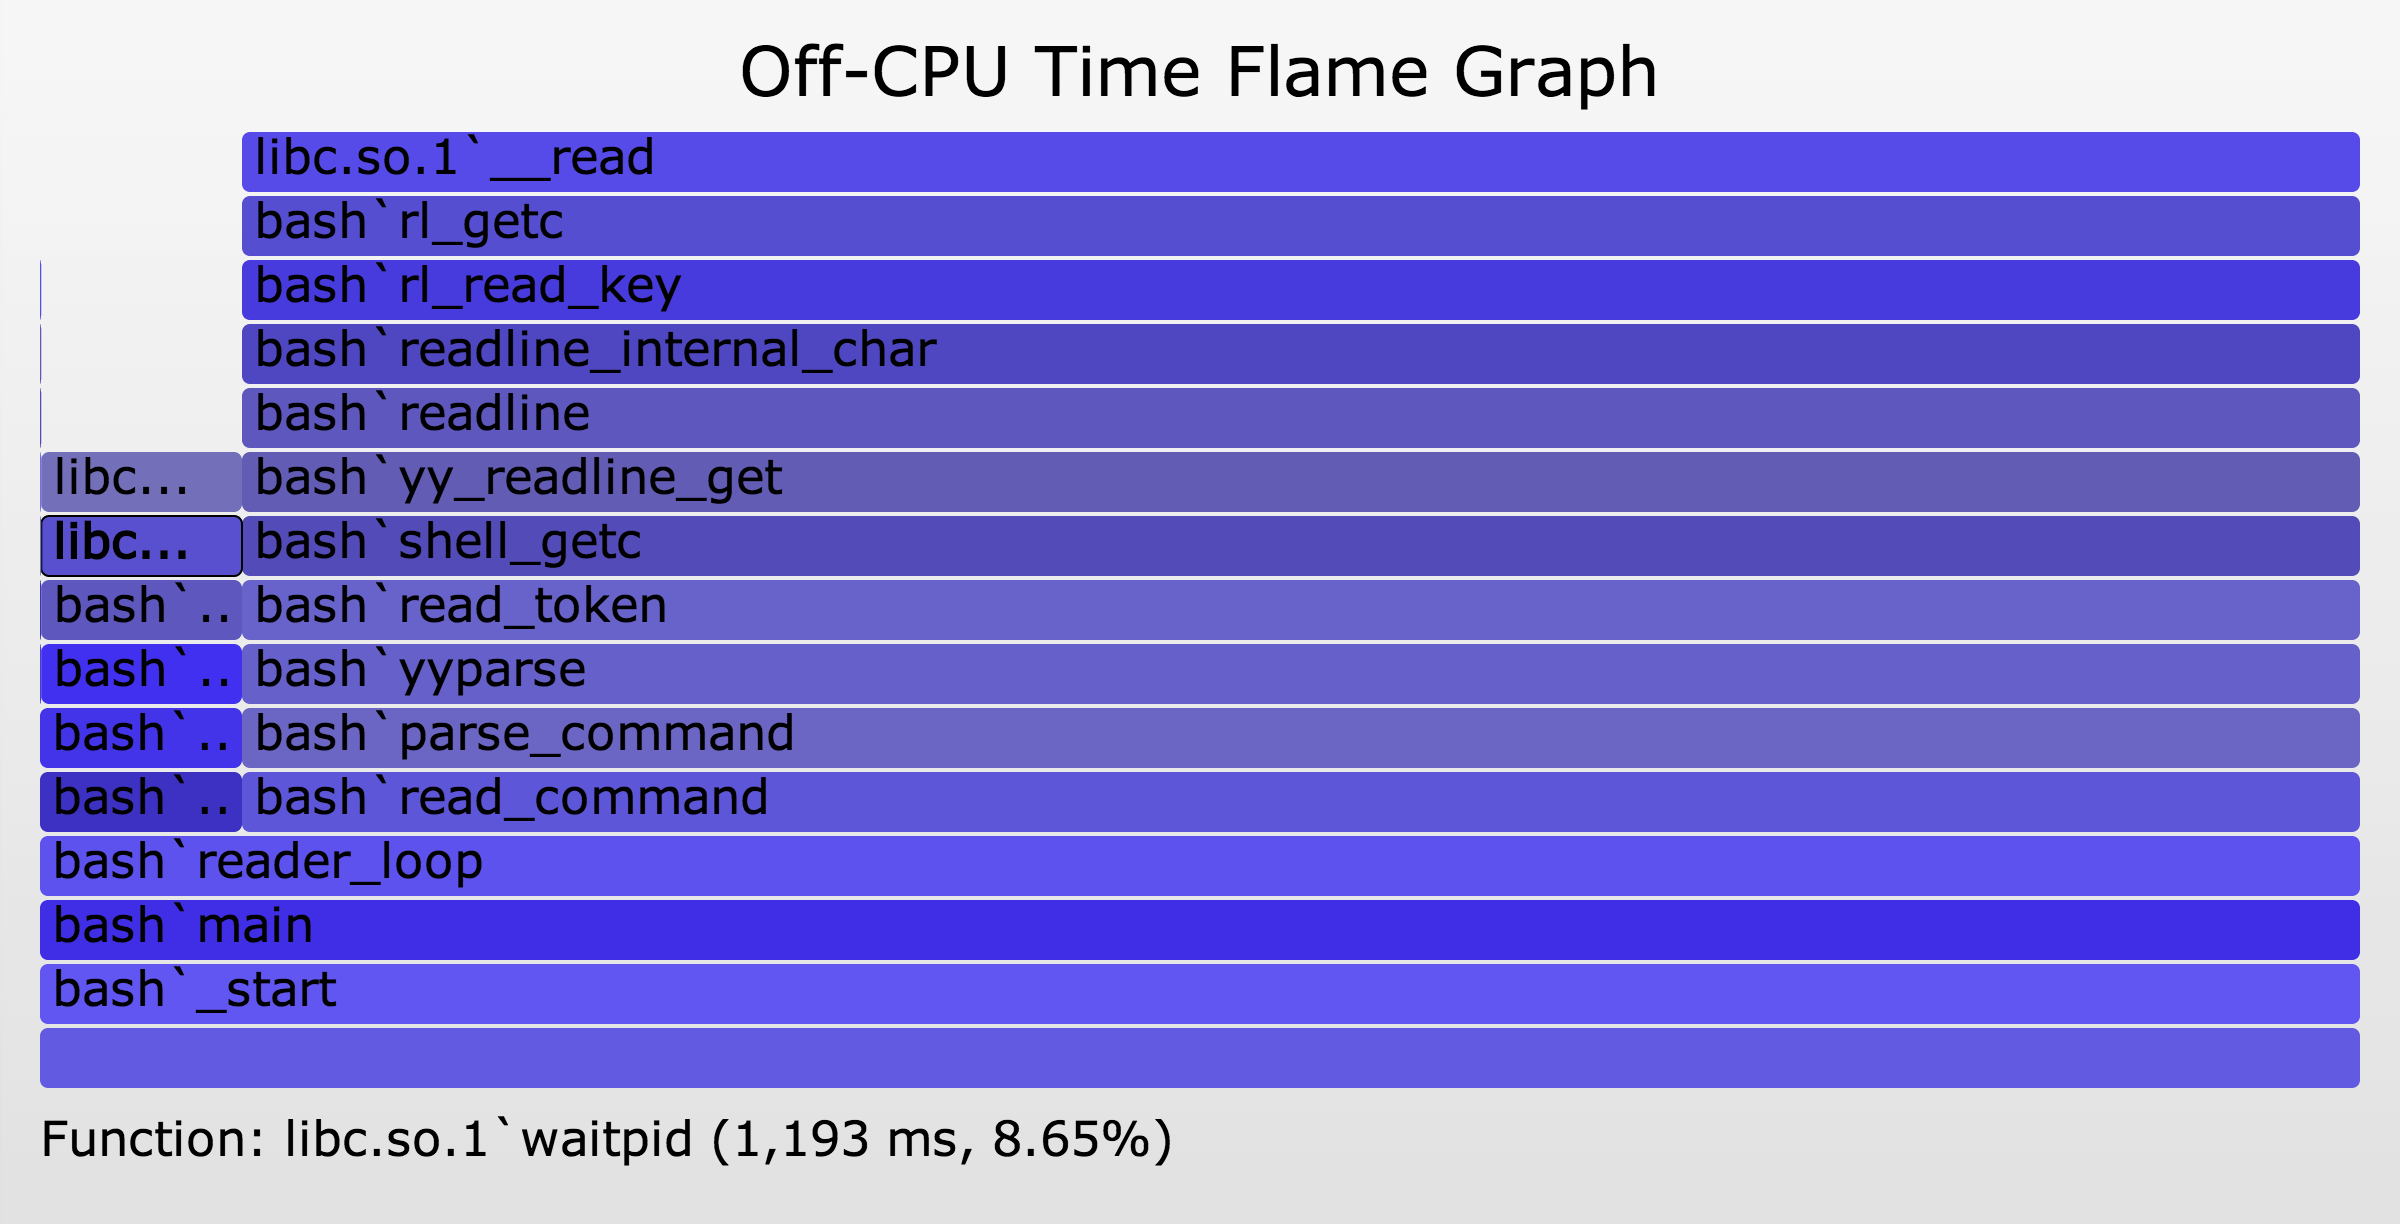
This uses a little awk to convert nanoseconds into milliseconds. The resulting Off-CPU Time Flame Graph (SVG, PNG):
This is a simple example to explain off-CPU time. The large column on the right, including bash`readline, is the time bash spent off-CPU waiting for keystrokes. The smaller column on the left is the time bash spent waiting for child processes. As this is an interactive shell, bash spends most of its time waiting for keyboard input, as expected.
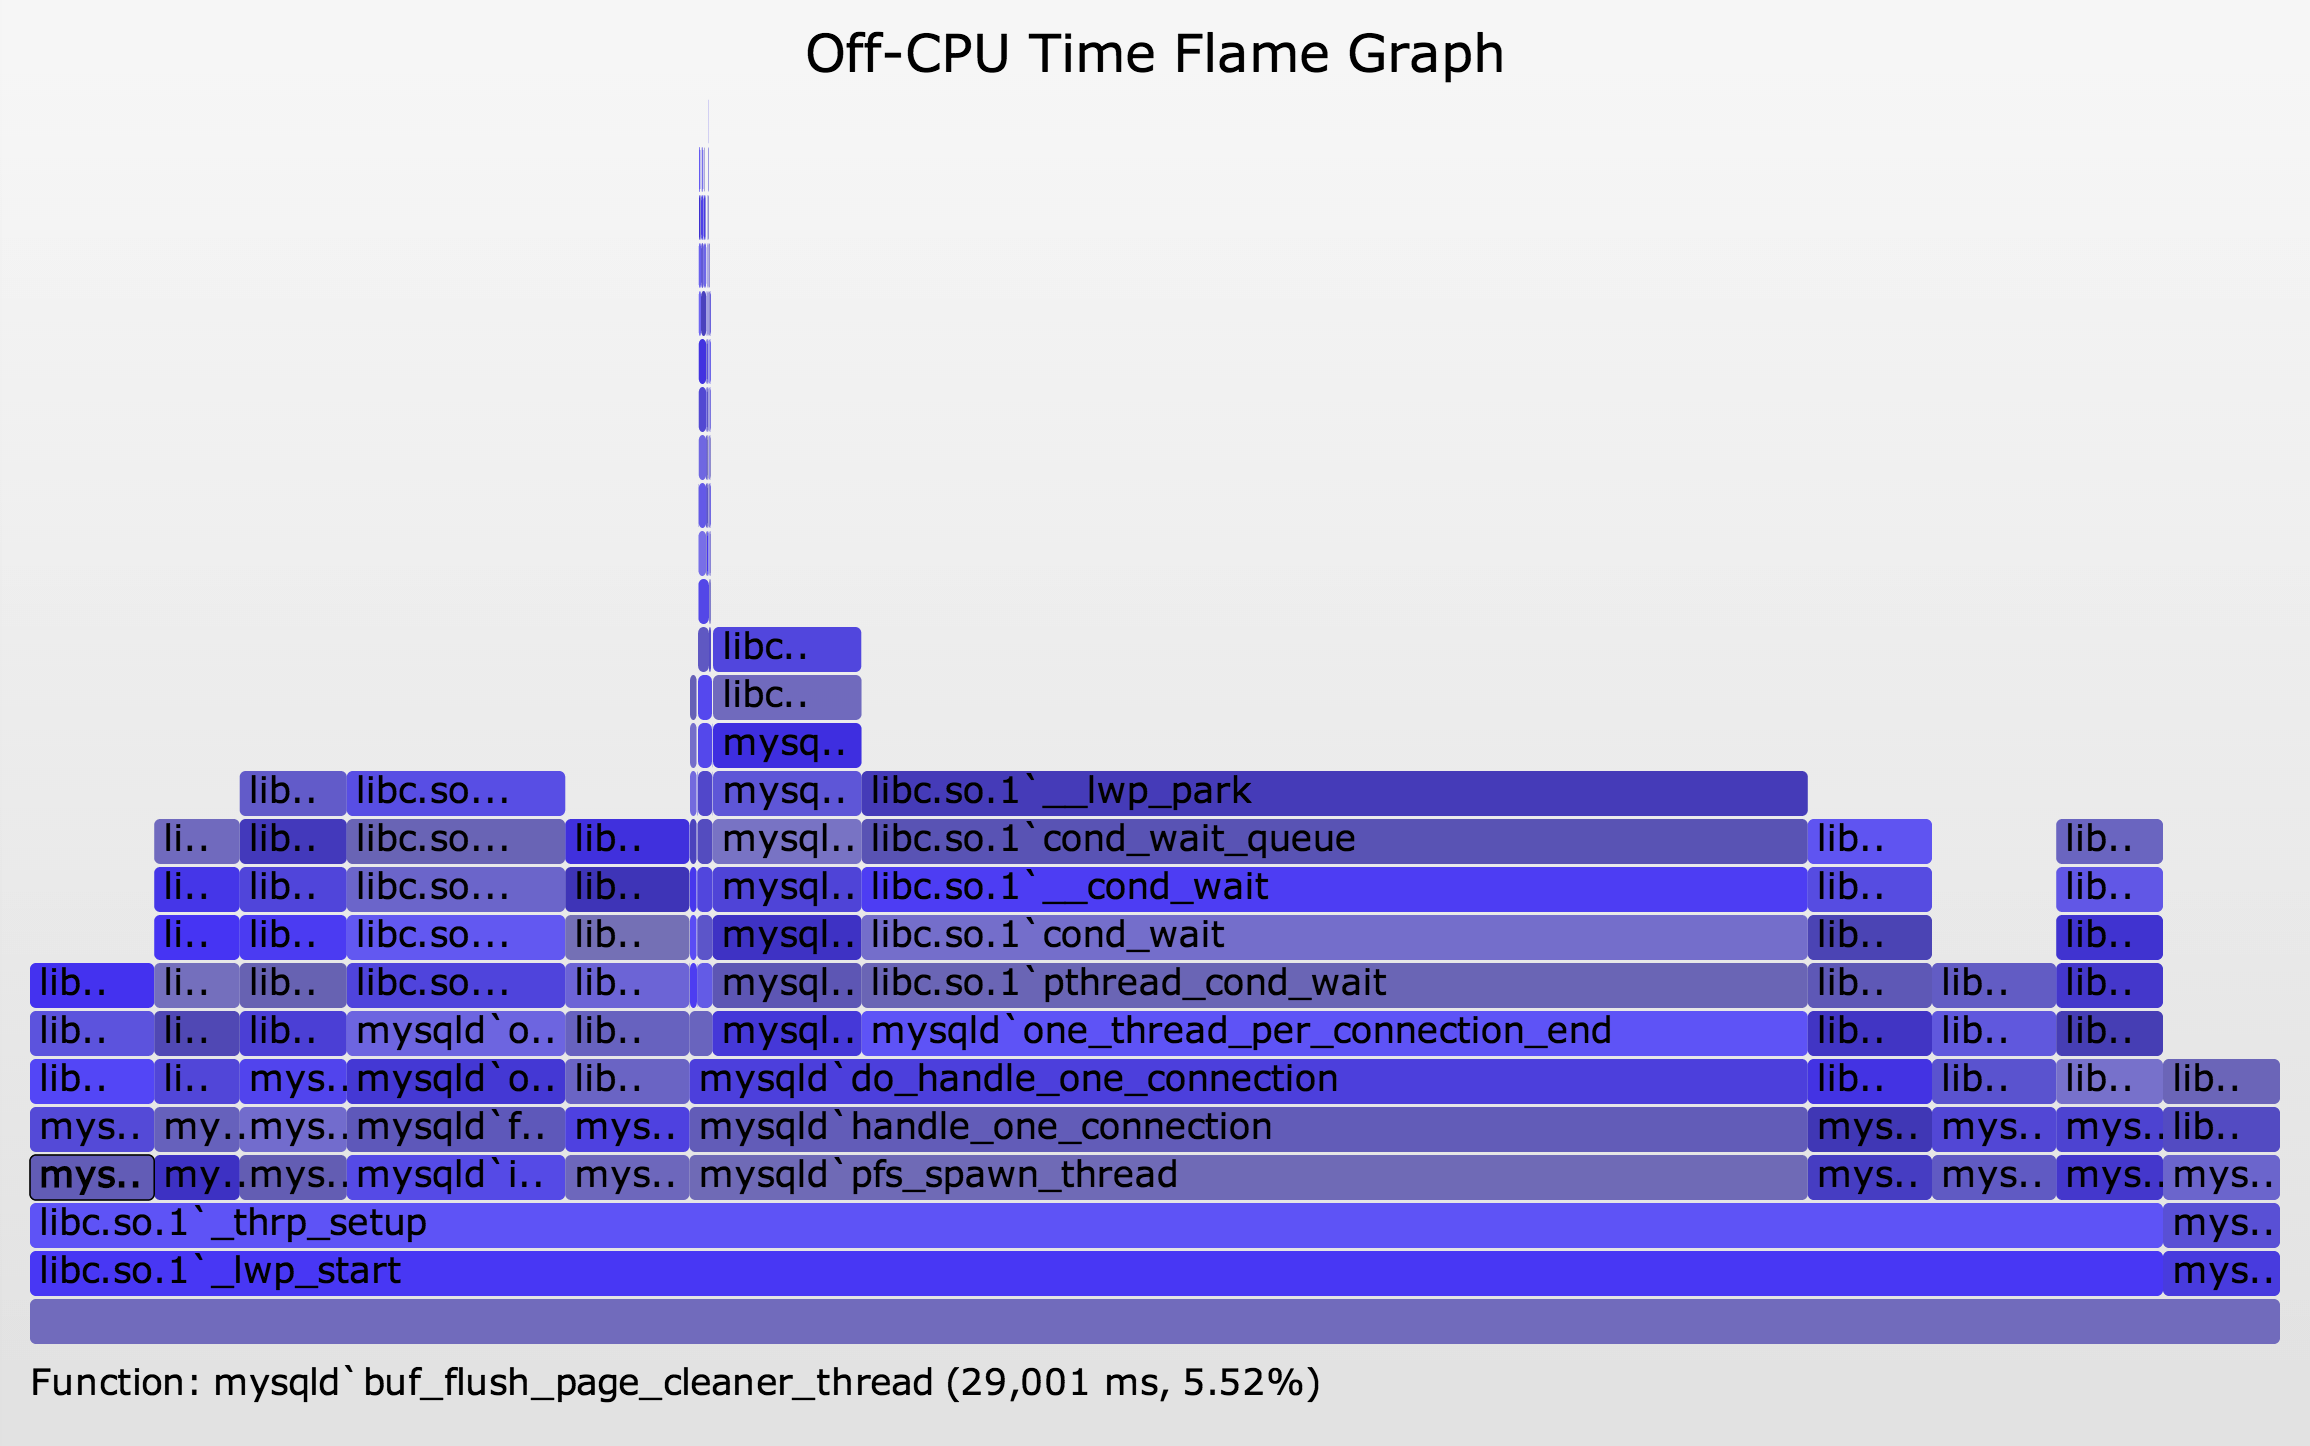
The following shows an off-CPU time flame graph for an idle MySQL server, traced for 30 seconds (SVG, PNG):
Now a problem with this type of analysis is evident: this flame graph shows considerable off-CPU time, but these are all for threads that are sleeping waiting for work. This is fascinating for a number of reasons:
- This has revealed various code-paths that MySQL uses for housekeeping or waiting for work. Each of the columns represents a single thread, and if you mouse-over the 3rd row from the bottom, the function name describes the thread's task. Eg, dict_stats_thread, io_handler_thread, etc. The number of different thread types that MySQL uses can be seen by counting the columns.
- Most columns are less than 30 seconds wide. These are likely to represent single threads. Some show 29 seconds, some 25 seconds, and one is 20 seconds. I would guess that these are for threads which wake up every 1, 5, and 10 seconds respectively, with the final wakeup not caught by the 30 second tracing window.
- Some columns are more than 30 seconds wide. These are likely to represent a pool of threads that are executing the same code, and their total wait time sums to be higher than the elapsed tracing time.
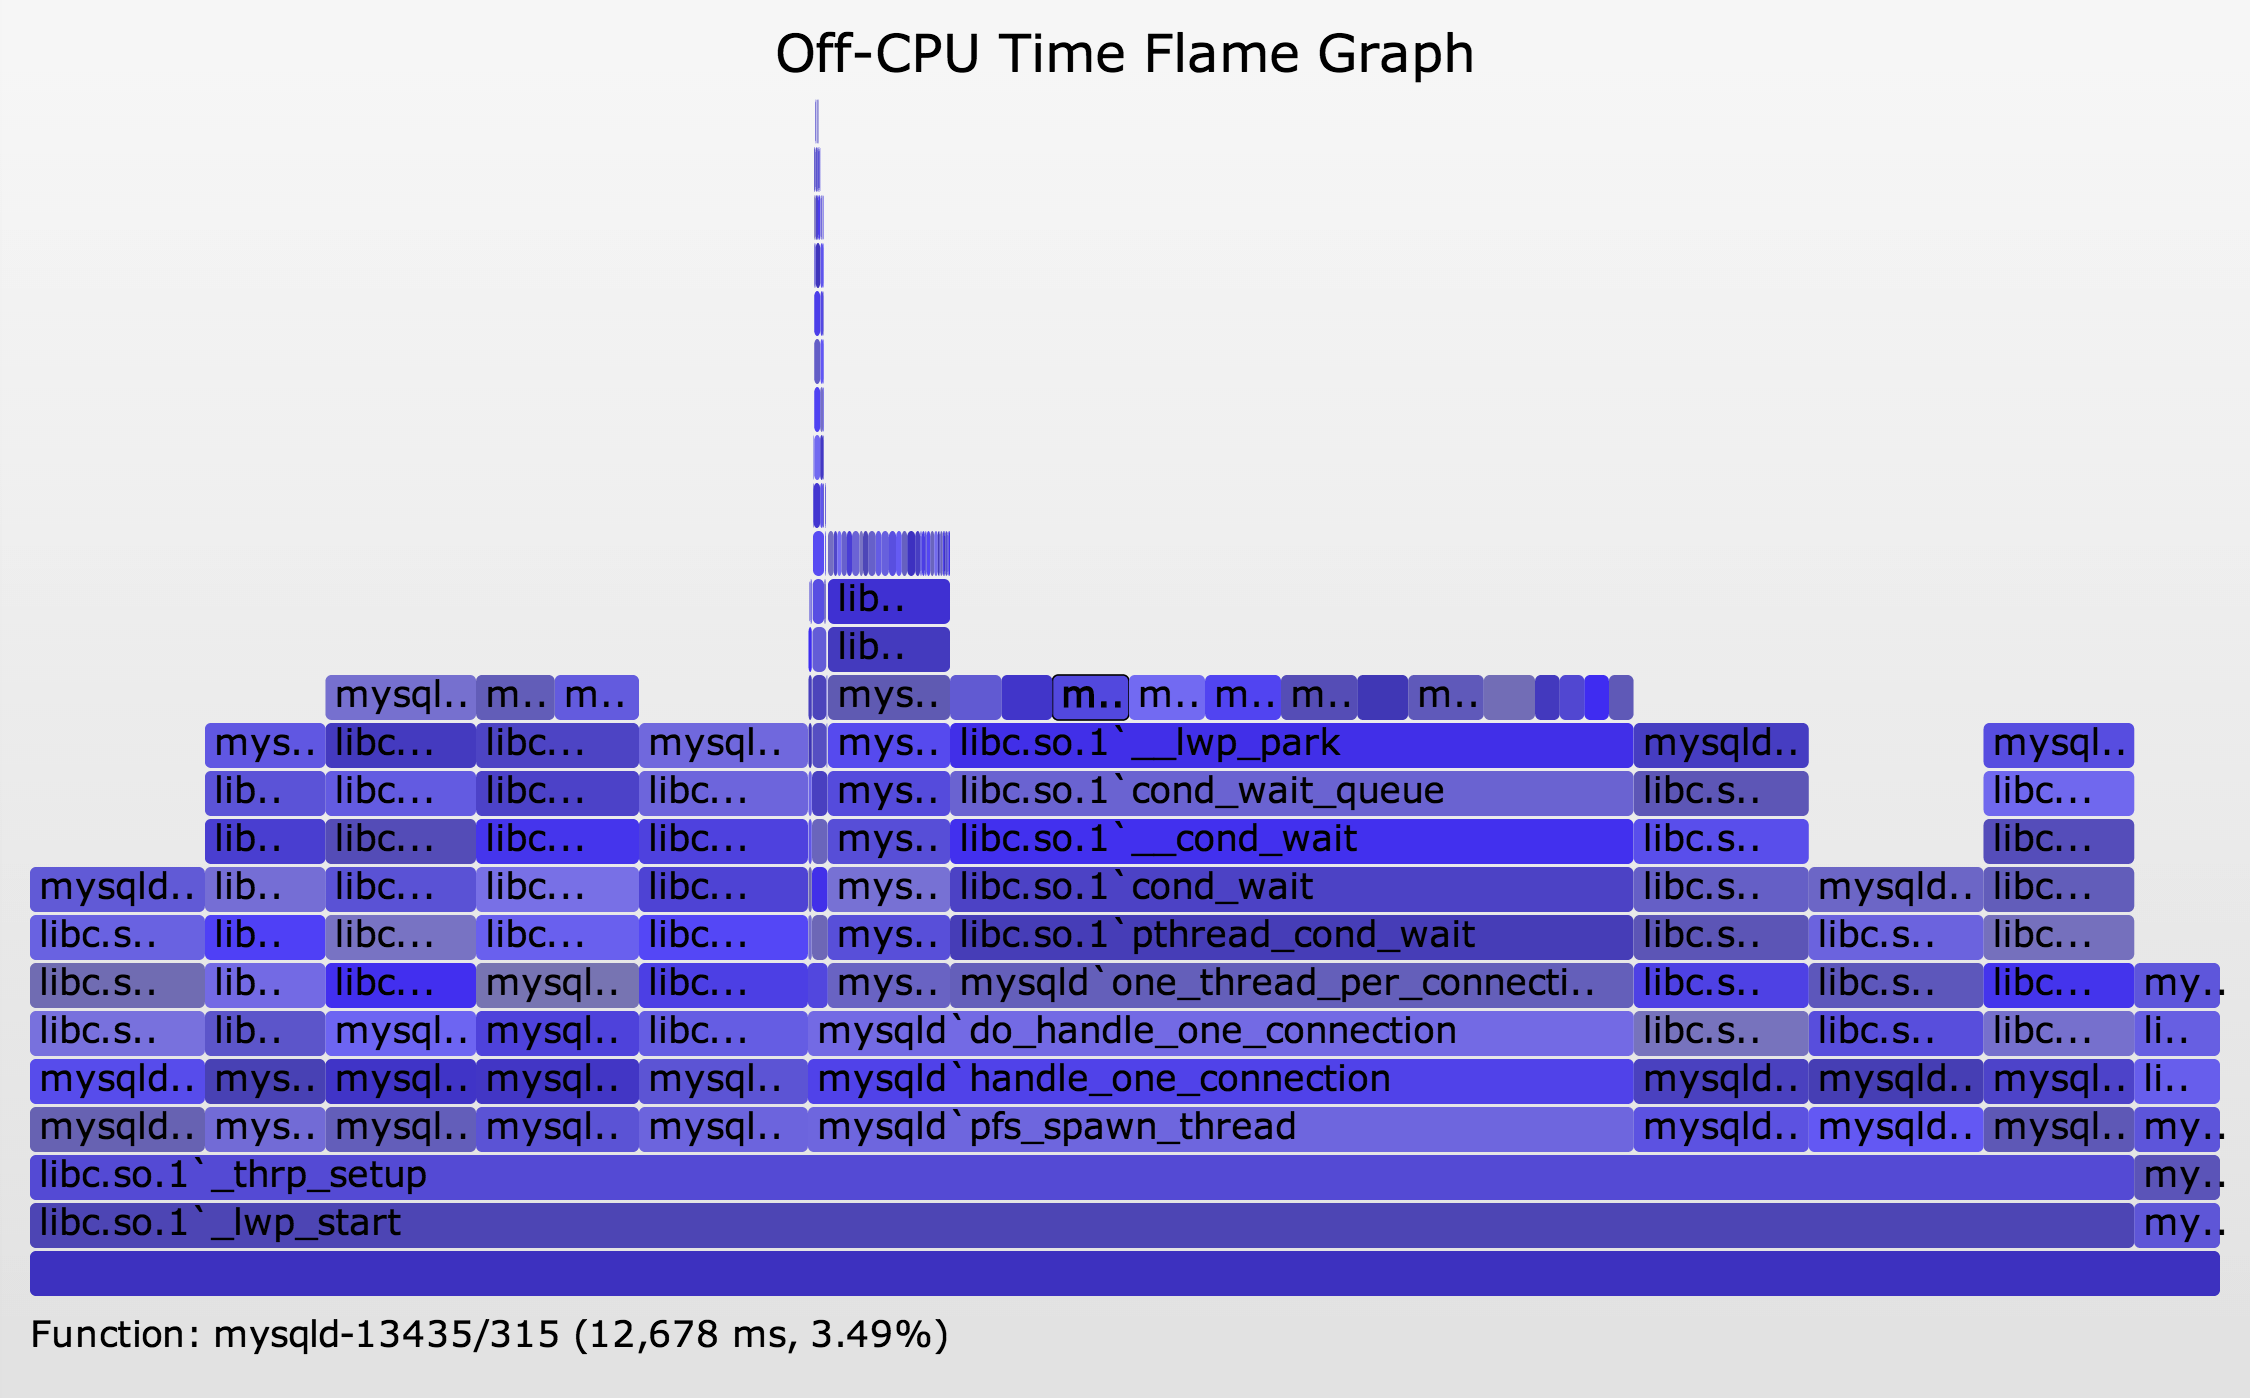
This has encouraged me to enhance the visualization a little, adding a frame on top of each stack for each thread (SVG, PNG):
The extra frame contains the process name, process ID, and thread ID. You can spot the thread pools by counting the top frames.
This off-CPU by-thread time flame graph was created using the same commands as earlier, with this different DTrace script:
#!/usr/sbin/dtrace -s

#pragma D option ustackframes=100

sched:::off-cpu /execname == "mysqld"/ { self->ts = timestamp; }

sched:::on-cpu
/self->ts/
{
	@[execname, pid, curlwpsinfo->pr_lwpid, ustack()] =
	    sum(timestamp - self->ts);
	self->ts = 0;
}

dtrace:::END { printa("\n%s-%d/%d%k%@d\n", @); }
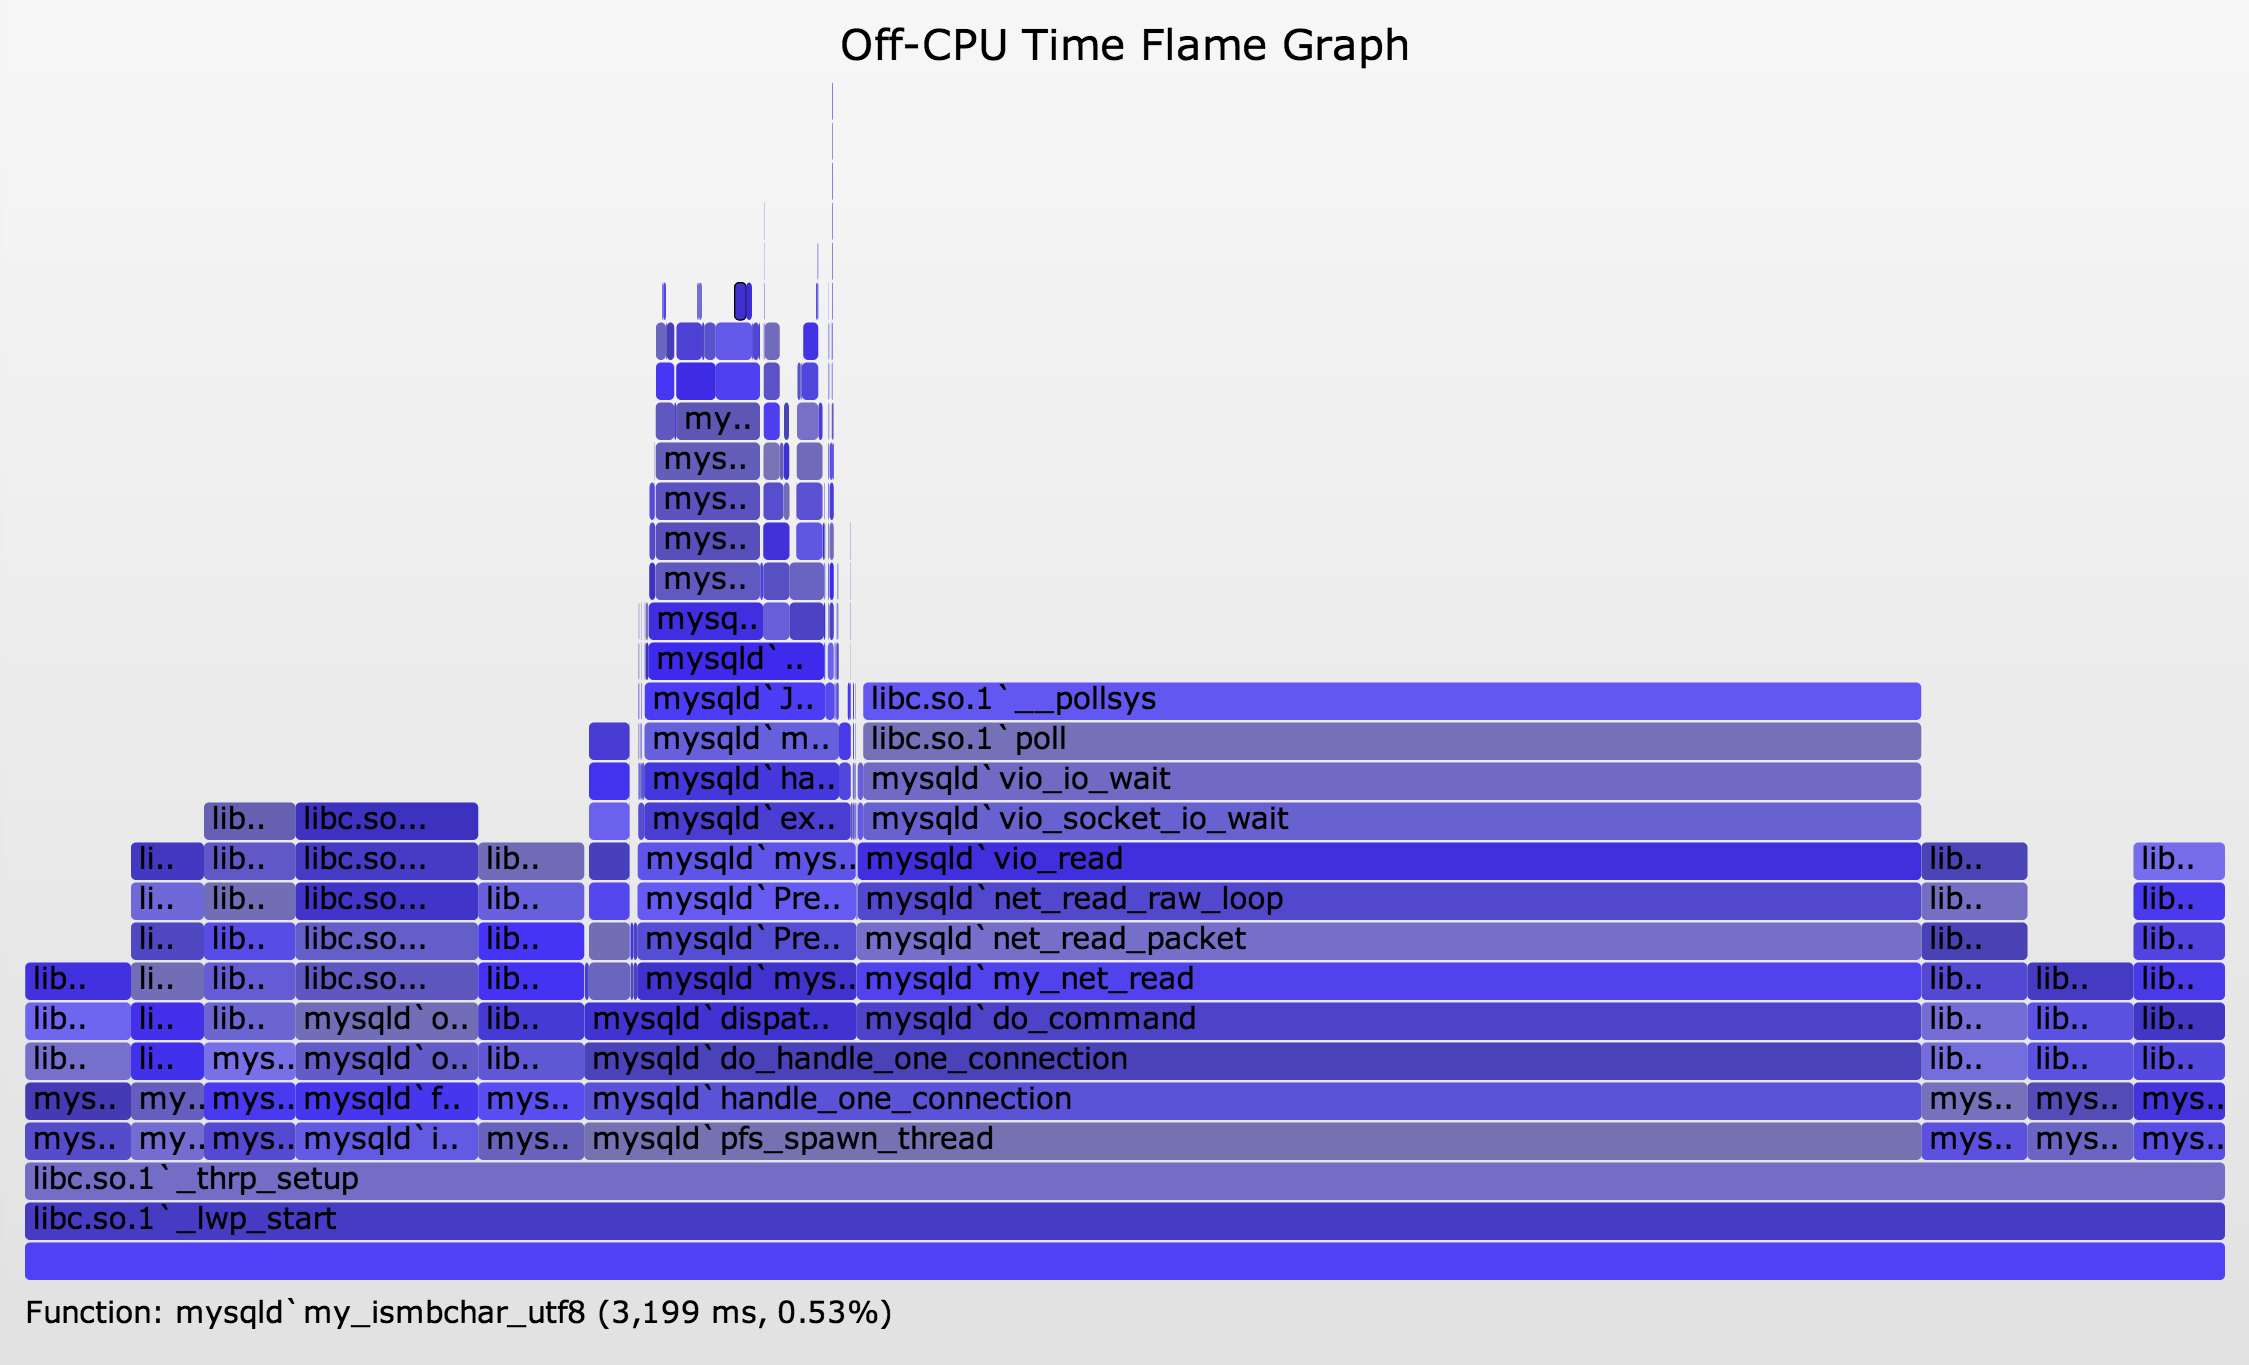
Finally, here is the same MySQL server, but this time processing work (SVG, PNG):
Now there are additional off-CPU paths during mysqld`dispatch_command, which will be of most interest to analyze, as they are synchronous with the application request (dispatch_command).
There are a few challenges with this type of analysis. Having multiple threads on one flame graph can be more confusing than it was for CPU flame graphs, since off-CPU time usually overlaps, and a pool of idle threads can dominate – as we saw here. Adding thread information frames, as I showed, or having ways to zoom in on the more interesting paths of the flame graph can help.
But a more difficult challenge is that the off-CPU stack traces often don't explain what the performance problem is. In user-level, the stack may show that the application is blocked on file descriptor I/O, or waiting on a lock, but not why this took so much time. Kernel-level stacks can shed some more light, but these still can hit the same problem. The problem is that off-CPU stacks can be waiting on some other thread or resource to wake them up, and we'd like to know what that other thread or resources is, and why it took time.
3. Wakeup
Since wakeups are processed by the kernel, they can be traced – in particular, the stack trace of the thread performing the wakeup. This lets us solve more problems than off-CPU tracing alone, as the wakeup information can explain the real reason for blocking. This is an advanced activity, and as with tracing off-CPU events you need to be careful with the overheads, which can start to add up depending on the rate of events and profiler you use.
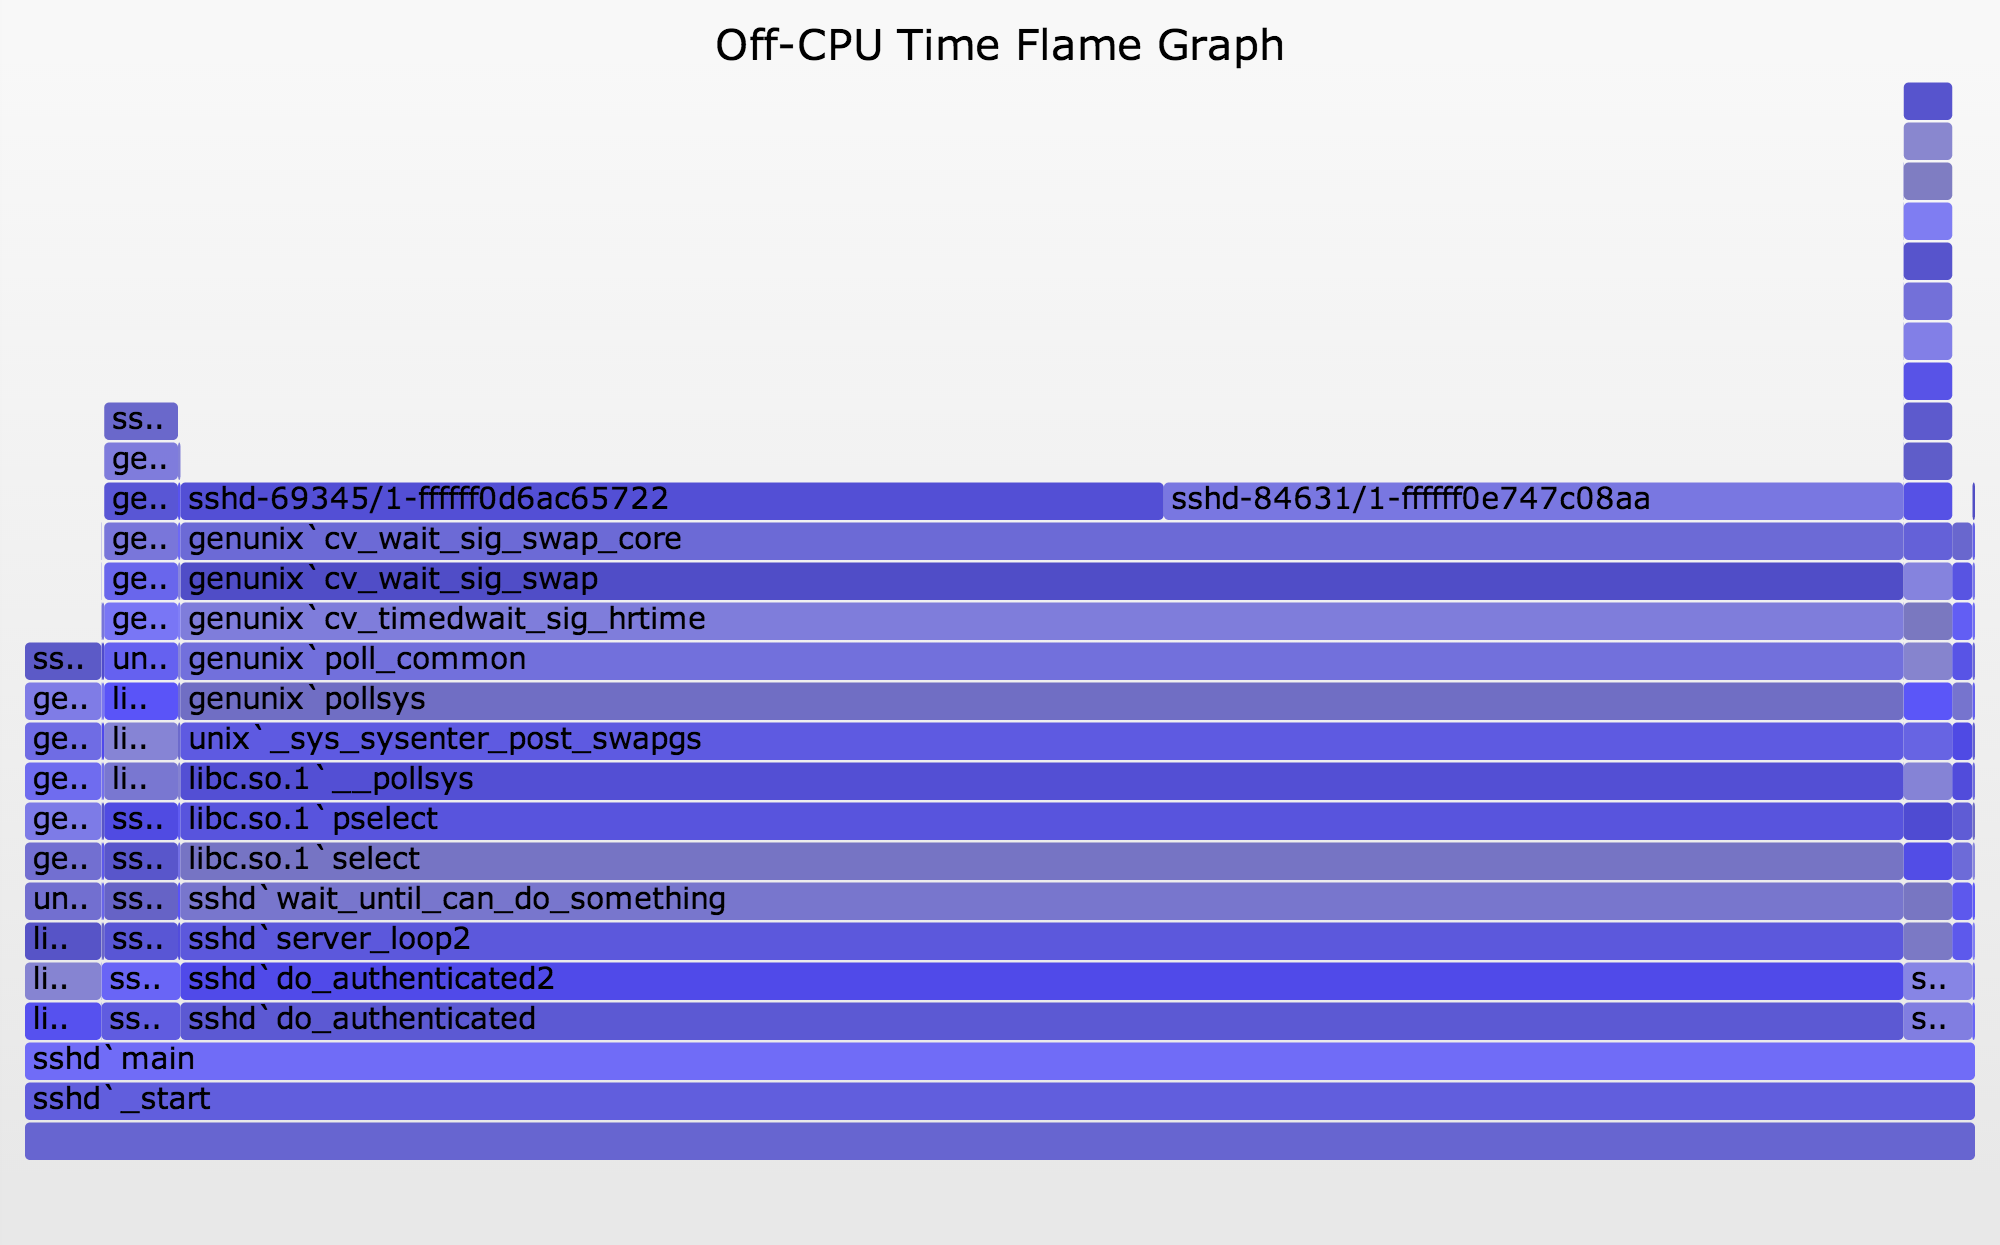
As a simple example, I'll start with an off-CPU time flame graph for the secure shell, sshd (SVG, PNG):
This time I've included both kernel- and user-level stacks, with the kernel on top. I've also added top information frames that show the process name, process ID, thread ID, and the object address that the thread is sleeping on. For example, on the top right is sshd-84631/1-ffffff0e747c08aa, which is sshd PID 84631 thread 1 sleeping on object ffffff0e747c08a.
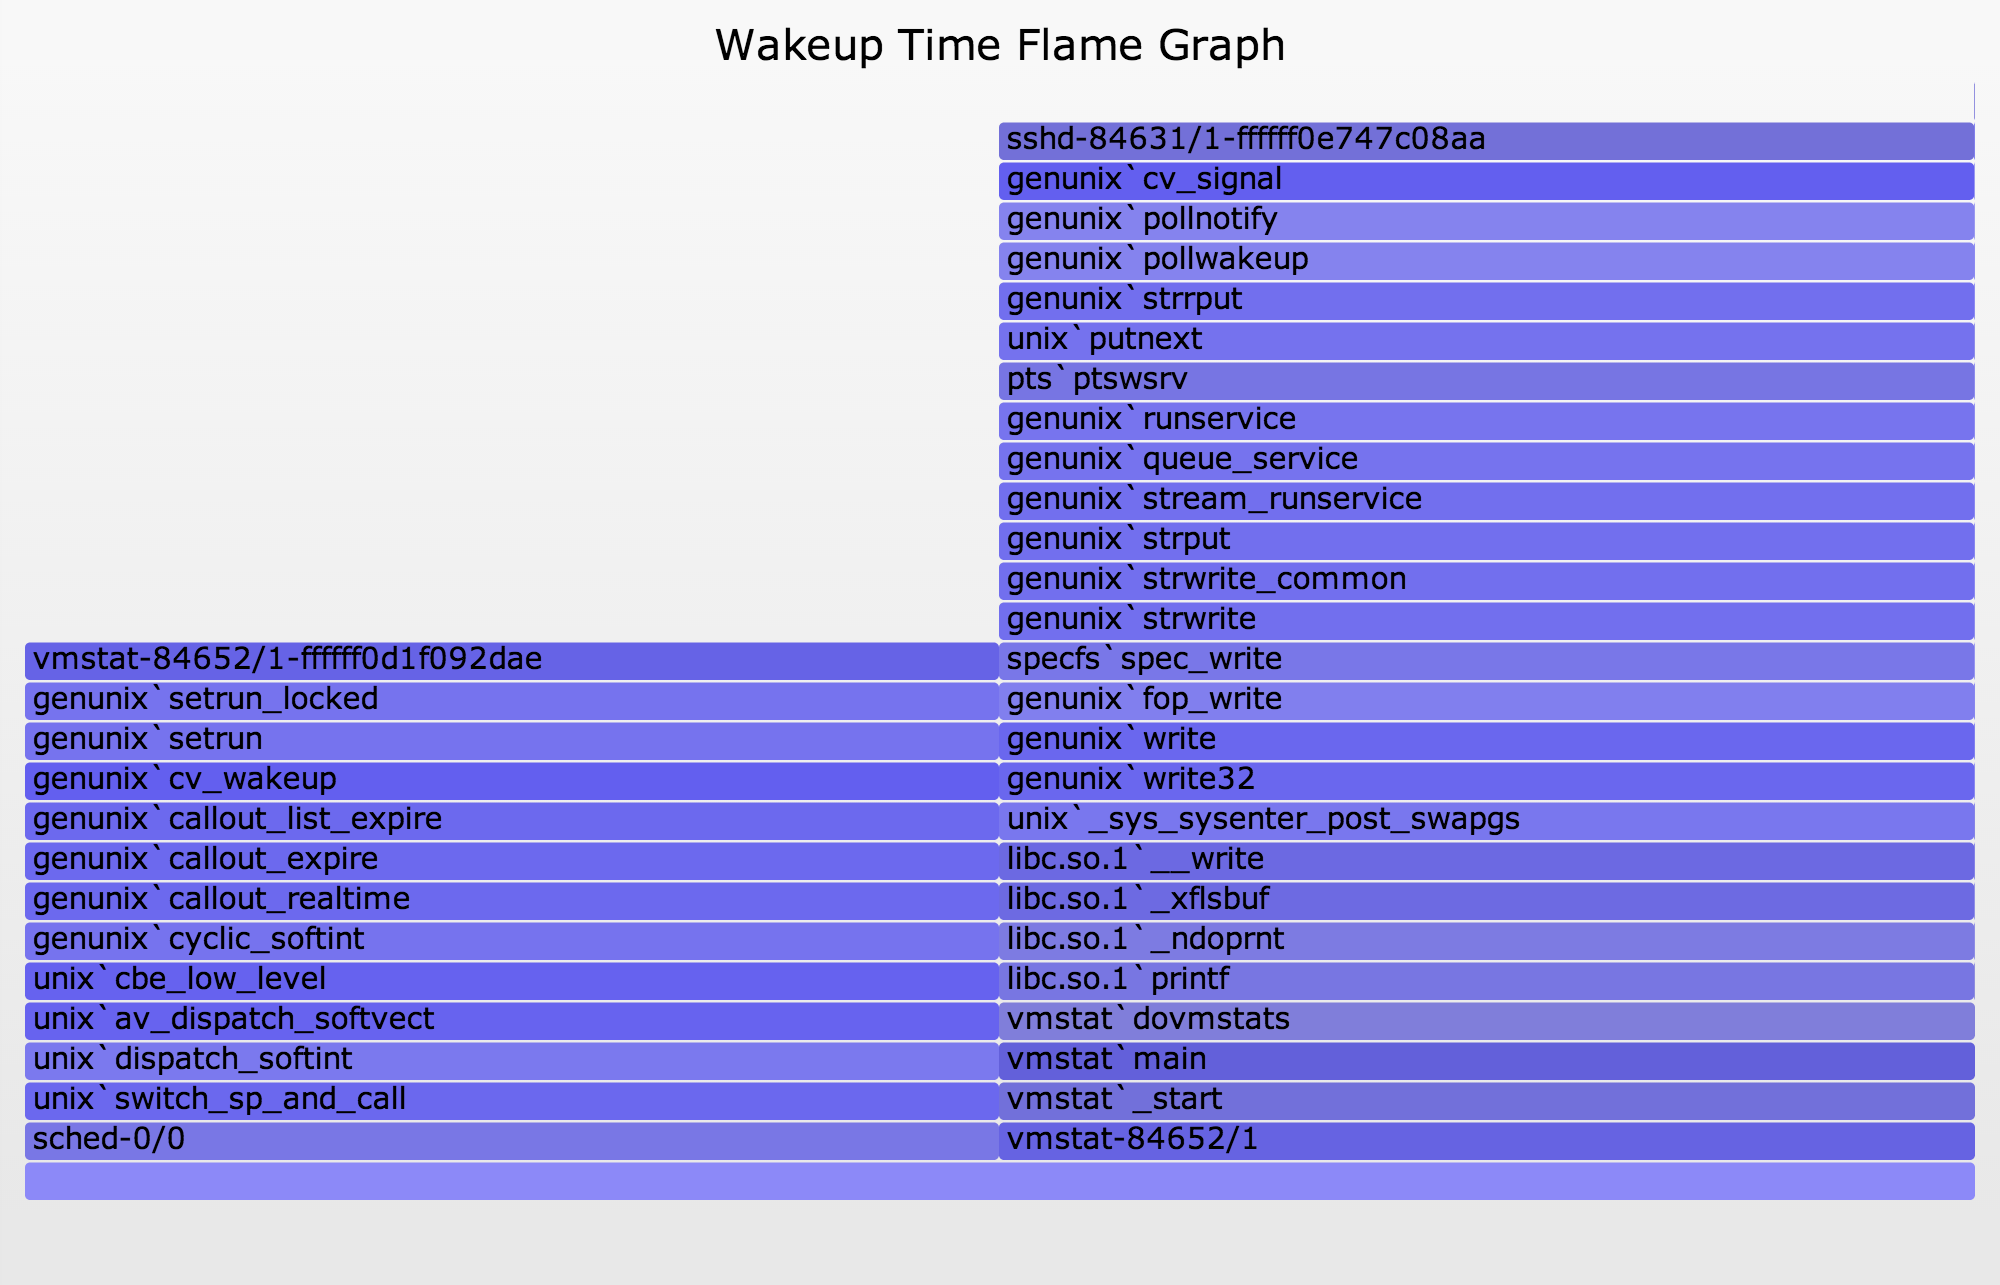
Now to trace wakeups. I've traced the time from when the target sshd slept on an object, to when a wakeup was sent to that object. The stack trace is measured from the thread performing the wakeup – not the target of the wakeup. This may reveal why we were waiting – the code-path that led to the wakeup being issued. The resulting Wakeup Time Flame Graph, also including both user- and kernel-stacks (SVG, PNG):
The ffffff0e747c08a object is the right column, and the stack beneath it shows what led to the wakeup being sent. It was vmstat! Indeed, while tracing, I had a vmstat 1 running in an ssh session, and as vmstat printed a line of output every second, it woke up sshd.
Now we know that sshd was waiting on vmstat. But what was vmstat waiting on?
Had I created an off-CPU flame graph with object IDs for vmstat, I would have seen that it was waiting on ffffff0d1f092dae. I caught this object in my wakeup time flame graph, and can see what it was waiting on: a timer interrupt, which would be driven by a hardware timer. This makes sense, as this is vmstat waiting on its interval timer.
The DTrace program I used to trace wakeups along with all the information was:
#!/usr/sbin/dtrace -s

#pragma D option quiet
#pragma D option ustackframes=100
#pragma D option stackframes=100
int related[uint64_t];

sched:::sleep
/execname == "sshd" || execname == "vmstat"/
{
	ts[curlwpsinfo->pr_addr] = timestamp;
}

sched:::wakeup
/ts[args[0]->pr_addr]/
{
	this->d = timestamp - ts[args[0]->pr_addr];
	@[args[1]->pr_fname, args[1]->pr_pid, args[0]->pr_lwpid, args[0]->pr_wchan,
	    stack(), ustack(), execname, pid, curlwpsinfo->pr_lwpid] = sum(this->d);
	ts[args[0]->pr_addr] = 0;
}

dtrace:::END
{
	printa("\n%s-%d/%d-%x%k-%k%s-%d/%d\n%@d\n", @);
}
This matches both sshd and vmstat. I had run it originally with just sshd, and found it was blocked on vmstat, so added vmstat. The output from this is fed into stackcollapse.pl and flamegraph.pl as with off-CPU flame graphs.
So with both off-CPU and wakeup stack information, and some human navigation and cross-referencing, we can follow latency from the application down to metal. Would it be possible to programatically follow wakeups and objects, to build a chain of stacks from application latency to metal? And how could this be visualized?
4. Chain Graph
This is a flame graph-based visualization to show both off-CPU stacks and full wakeup stack chains, so that latency can be root caused.
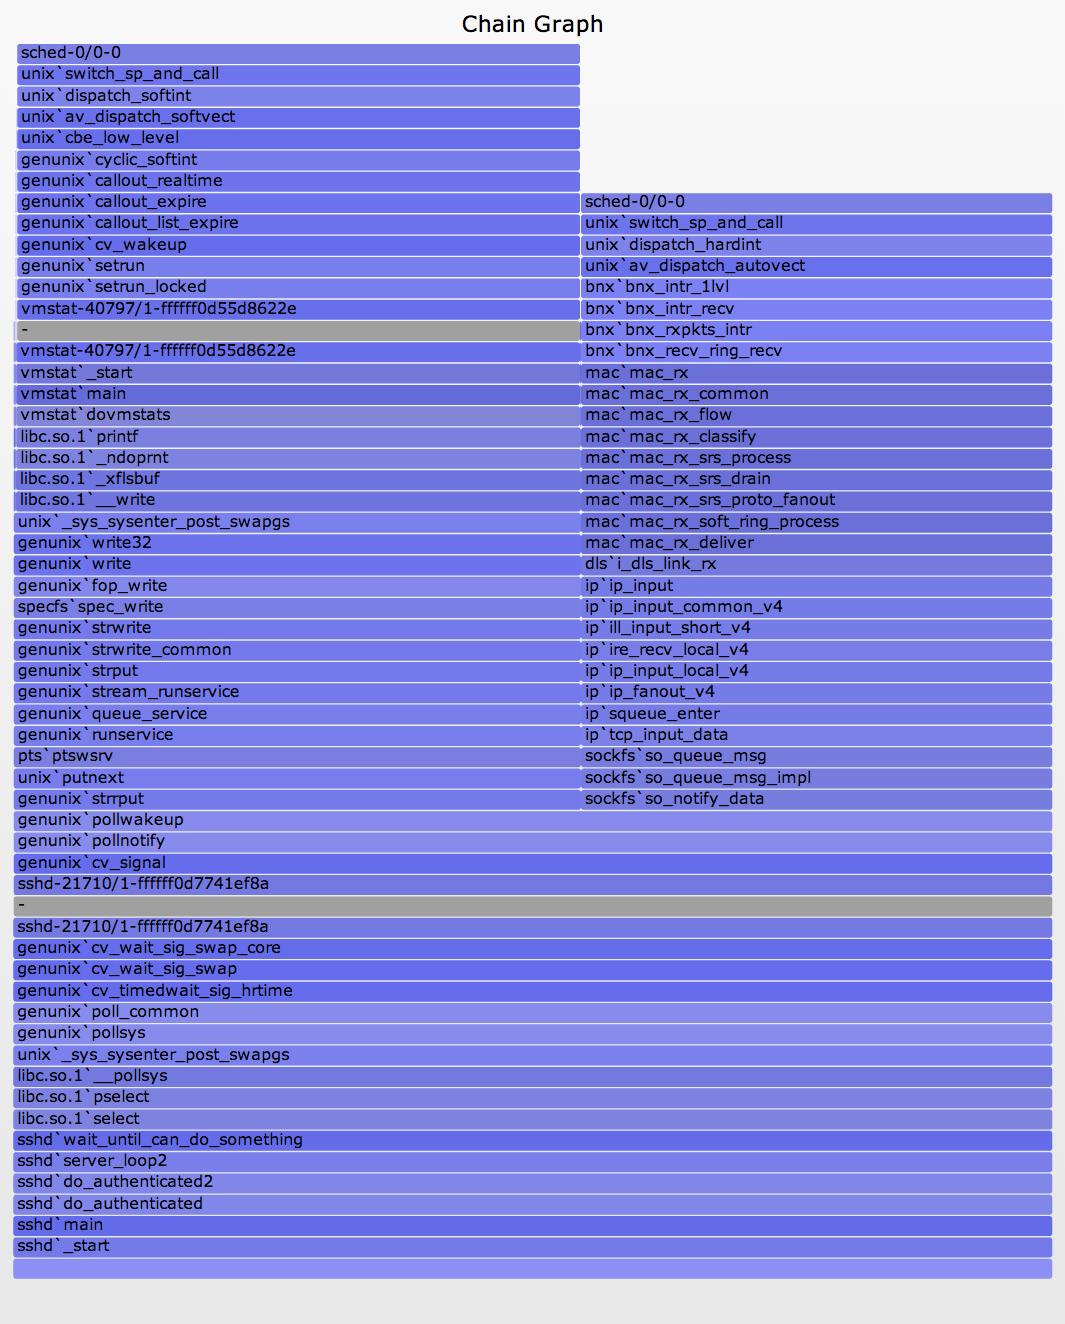
This sshd example follows on from previous section. The chain graph is shown here with labels on the left (SVG, PNG):
 |
At the bottom is the off-CPU stack, with a gray frame on top. Above that are wakeup stacks in reverse order. Multiple wakeup stacks are separated by an additional gray frame.
This is how you read this:
- bottom-up: up to the first gray frame shows the code-path that led to a blocking and off-CPU event.
- top-down: down to the bottom gray frame shows the chain of code-paths that led to wakeup up an of-CPU event.
I've tried a variety of arrangements, and this has been the best so far.
See the main Flame Graphs page for other types of flame graphs and links, and the flame graph software.