I originally posted this at http://blogs.sun.com/brendan/entry/jbod_analytics_example.
The Analytics feature of the Sun Storage 7000 series provides a fantastic new insight into system performance. Some screenshots have appeared in various blog posts, but there is a lot more of Analytics to show. Here I'll show some JBOD analytics.
Bryan coded a neat way to breakdown data hierarchically, and made it available to by-filename and by-disk statistics, along with pie charts. While it looks pretty, it is incredibly useful in unexpected ways. I just used it to identify some issues with my JBOD configuration, and realized after the fact that this would probably make an interesting blog post. Since Analytics archived the data I was viewing, I was able to go back and take screenshots of the steps I took, which I've included here.
The problem
I was setting up a NFSv3 streaming write test after configuring a storage pool with 6 JBODs, and noticed that the disk I/O was a little low:
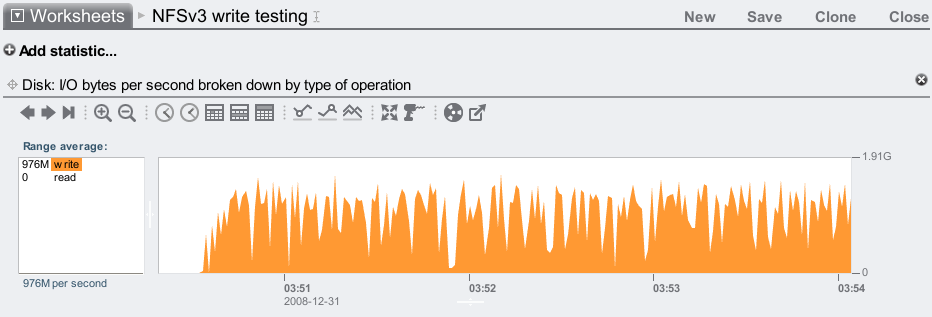
This is measuring disk I/O bytes: I/O from the Sun Storage 7410 head node to the JBODs. I was applying a heavy write workload which was peaking at around 1.6 Gbytes/sec, but I know the 7410 peaks higher than this.
Viewing the other statistics available, I noticed that the disk I/O latency was getting high:

Most of the ops/sec were around 10 ms, but there are plenty of outliers beyond 500 ms, shown in the screenshot above. These disk I/O operations are from ZFS flushing data asynchronously to disk in large chunks, where the I/Os can queue up for 100s of ms. The clients don't wait for this to complete. So while some of this is normal, the outliers are still suspiciously high and worth checking further. Fortunately Analytics lets us drill down on these outliers in other dimensions.
As I had just onlined 144 new disks (6 JBODs worth), it was possible that one may have a performance issue. It wouldn't be an outright disk error – the Sun Storage software would pick that up and generate an alert, which hadn't happened. I'm thinking of others issues, where the disk can take longer than usual to successfully read sectors (perhaps from a manufacturing defect, vibration issue, etc.). This can be identified in Analytics by looking at the I/O latency outliers by disk.
From the left panel in the disk I/O by latency statistic, I selected 220 ms, right clicked and selected to break this down by disk:

If there is a disk or two with high latency, they'll usually appear at the top of the list on the left. Instead I have a list of disks with roughly the same average number of 220+ ms disk I/Os. I think. There are 144 disks in that list on the left, so it can take a while to scroll down them all to check (and you need to click the "..." ellipsis to expand the list). This is where the "Show hierarchy" button on the left is helpful – it will display the items in the box as wedges in a pie chart, which makes it easy to check if they all look the same:
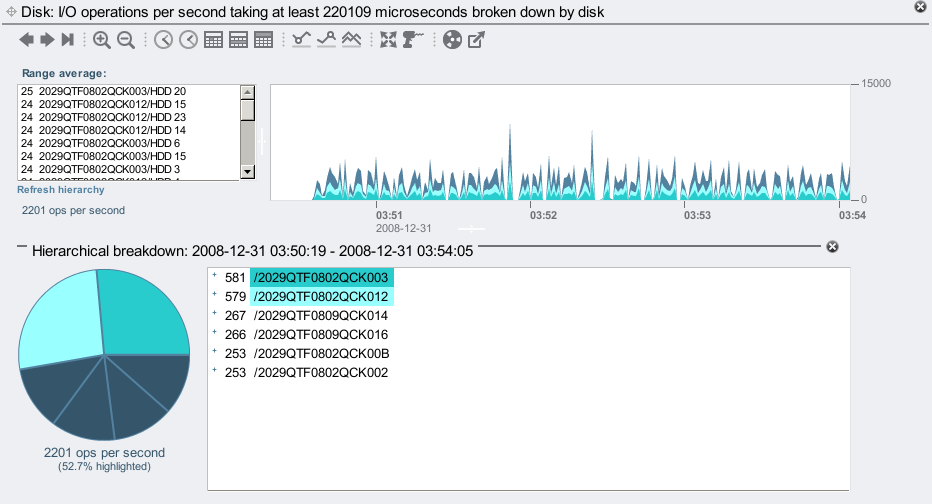
Instead of displaying every disk, the pie chart begins by displaying the JBODs (the top of the hierarchy). You can click the little "+" sign in the hierarchy view to show individual disks in each JBOD, like so:

But I didn't need to drill down to the disks to notice something wrong. Why do the two JBODs I selected have bigger slices of the pie? These are identical JBODs, are equal members of a ZFS mirrored pool, and so my write workload should be sent evenly across all JBODs (which I used Analytics to confirm by viewing disk I/O operations by disk). So given they are the same hardware and are sent the same workload, they should all perform the same. Instead, two JBODs (whose names start with /2029 and end with 003 and 012) have returned slower disk I/O.
I confirmed the issue using a different statistic: average I/O operations by disk. This statistic is a little odd but very useful – it's not showing the rate of I/Os to the disks, but instead how many on average are active plus waiting in a queue (length of the wait queue). Higher usually means I/Os are queueing for longer:
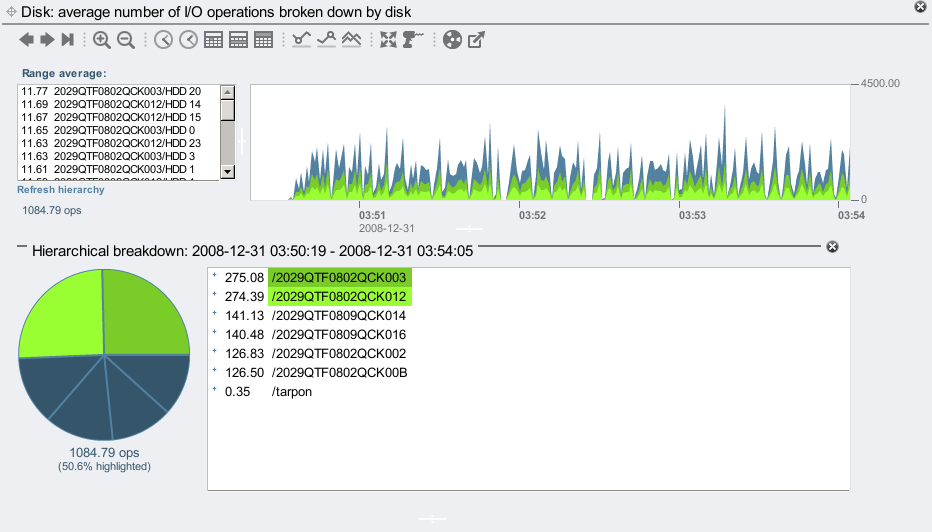
Again, these JBODs should be performing equally, and have the same average number of active and queued I/Os, but instead the 003 and 012 JBODs are taking longer to dispatch their I/Os. Something may be wrong with my configuration.
The Answer
Checking the Maintenance area identified the issue straight away:
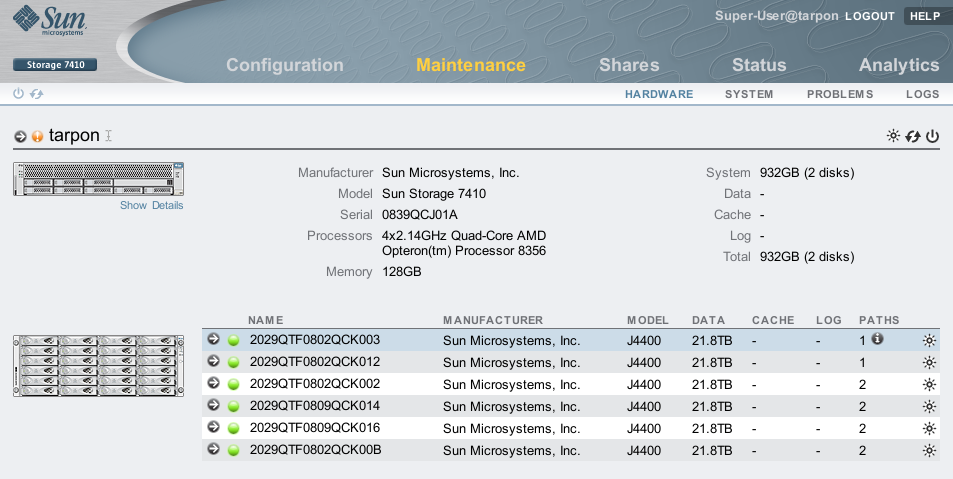
The JBODs ending in 003 and 012 have only one SAS path connected. I intended to cable 2 paths to each JBOD, for both redundancy and to improve performance. I cabled it wrong!
Fixing the JBOD cabling so that all JBODs have 2 paths has improved the write throughput for this test:

And our JBODs look more balanced:
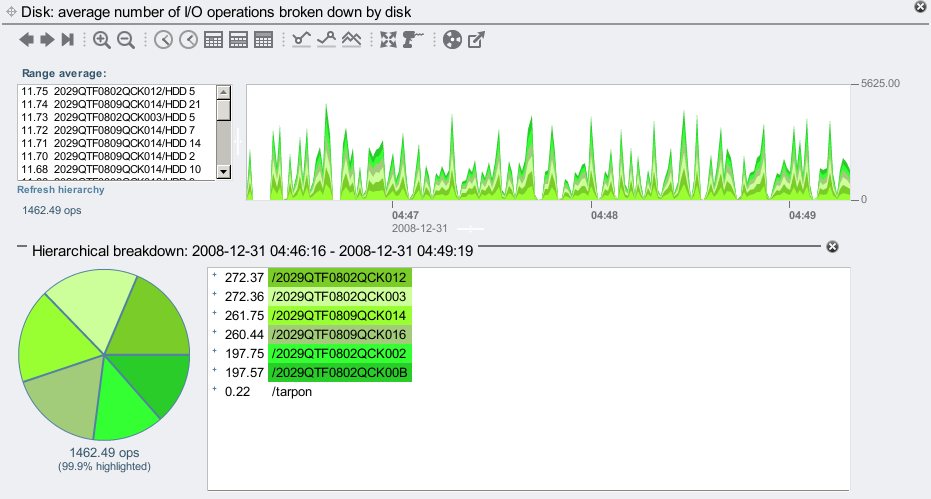
But they aren't perfectly balanced. Why do the 002 and 00B JBODs perform faster than the rest? Their pie slices are slightly smaller (~197 compared to 260-270 average I/Os). They should have equal disk I/O requests, and take the same time to dispatch them.
The answer again is cabling: the 002 and 00B JBODs are in a chain of 2, and the rest are in a chain of 4. There is less bus and HBA contention for the JBODs in the chain of 2, so they perform better. To balance this properly I should have cabled 2 chains of 3, or 3 chains of 2 (this 7410 has 3 x SAS HBAs, so I can cable 3 chains).
Thoughts
Imagine solving this with traditional tools such as iostat: you may dig though the numerous lines of output and notice some disks with higher service times, but not notice that they belong to the same JBODs. This would be more difficult with iostat if the problem was intermittent, whereas Analytics can constantly record all this information to a one second granularity, to allow after the fact analysis.
The aim of Analytics is not just to plot data, but to use GUI features to add value to the data. The hierarchy tree view and pie chart are examples of this, and were the key to identifying my configuration problems.
While I already knew to dual-path JBODs and to balance them across available chains, it's wonderful to so easily see the performance issues that these sub-optimal configurations can cause, and know that we've made identifying problems like this easier for everyone who uses Analytics.
