DtkshDemos
DtkshDemos is a miscellaneous collection of demonstration programs I wrote for the Desktop Korn Shell, dtksh. This shell has X11 support, which allows simple GUIs to be written in the shell. It was standard part of the Common Desktop Environment (CDE), popular on Unix systems in the late 1990s. Unfortunately, very few people ever used or knew about dtksh, and it hasn't caught on. I'm leaving this page online for software archaeologists.
When I created this in 2004, there were very few sample dtksh scripts on the Internet to learn from. After finding less than a dozen unique scripts, I was motivated to create and share some more advanced scripts as demonstrations of what dtksh can do.
Warning: Currently these are "demos" not "tools". The dtksh software has not been well maintained across different OSes, so often these scripts will run for a minute and then freeze. If dtksh were to be fixed at some point in the future, this website may be renamed "dtkshtools".
Note: The code is based on the dtksh and X11 man pages, I have seen very little code that actually used XmDrawingArea for plotting. You may find some official examples in /usr/dt/share/examples/dtksh, depending on your OS. Also note that these are designed to display in 24-bit colour.
Operating Systems
These programs require dtksh. They has been tested on Solaris, but they will probably work fine on HPUX, AIX and wherever else dtksh is available.
Contents
The following link to each script, and include an example screenshot.
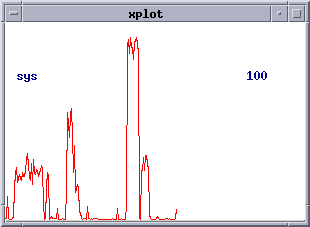
xplot - is a tool to plot a list of numbers read from STDIN. The idea was that whenever you are looking at a column of numbers (perhaps the output of a command or the contents of some log file), xplot could be used to graph them. Configurables include field, delimiter, size and colour.
In this example we run vmstat with a one second interval, then pipe this into xplot and take the 21st field "-f 20" and plot it. The maximum is 100 "-hi 100", and a title is set using "-t sys":
$ vmstat 1
 kthr      memory            page            disk          faults      cpu
 r b w   swap  free  re  mf pi po fr de sr dd dd f0 s3   in   sy   cs us sy id
 0 0 0 585144 88384   1   7  3  0  0  0  0  0  0  0  0  421  853  242  2  1 98
 0 0 0 539800 50024   0   7  0  0  0  0  0  0  4  0  0  459  990  318  3  0 97
 0 0 0 539800 50024   1   0  0  0  0  0  0  0  0  0  0  667 1334  459  1  3 96
^C
$
$ vmstat 1 | xplot -f 20 -hi 100 -t sys
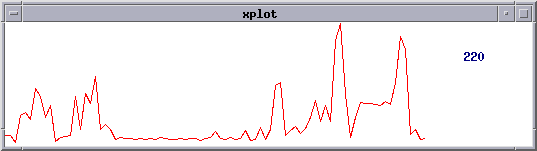
In this example we run netstat -i 1 to watch inbound packets. The first field is then plotted using xplot "-f 0" with a line colour of green "-lc Green" and an x increment per point of 5 "-inc 5":
$ netstat -i 1
    input   hme0      output           input  (Total)    output
packets errs  packets errs  colls  packets errs  packets errs  colls
2577891 0     3127581 0     0      4302512 0     4852202 0     0
106     0     74      0     0      112     0     80      0     0
85      0     58      0     0      91      0     64      0     0
64      0     44      0     0      70      0     50      0     0
^C
$
$ netstat -i 1 | tail +4 | xplot -f 0 -inc 5
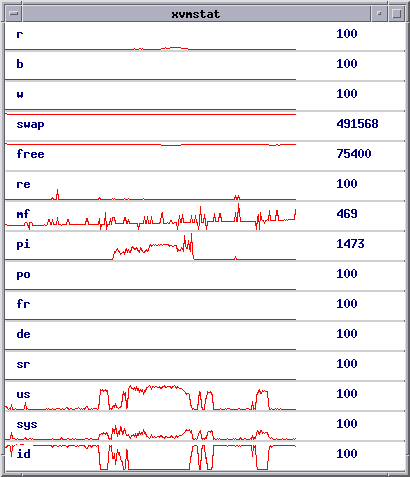
xvmstat - is a tool to plot the output of vmstat. Configurables include size and colour.
$ ./xvmstat -x 400 -y 450
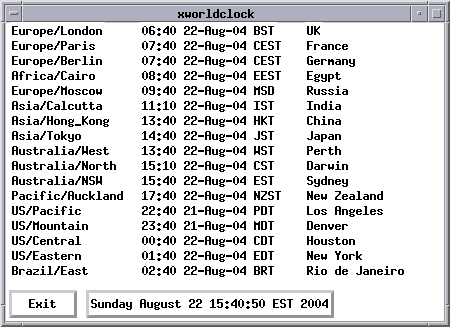
xworldclock
- is a tool to print times from around the world. Configurables include size and colour.
$ ./xworldclock
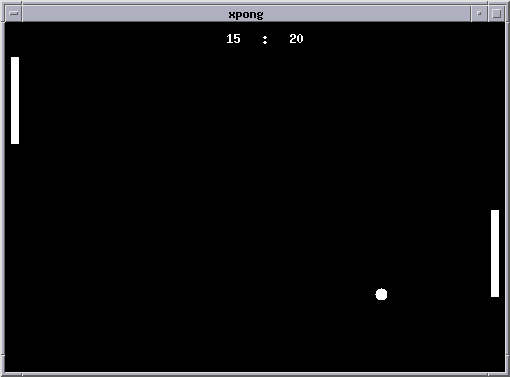
xpong
- is a demo of a game in dtksh. 1 or 2 player. I wrote this to see how well it would perform...
$ ./xpong
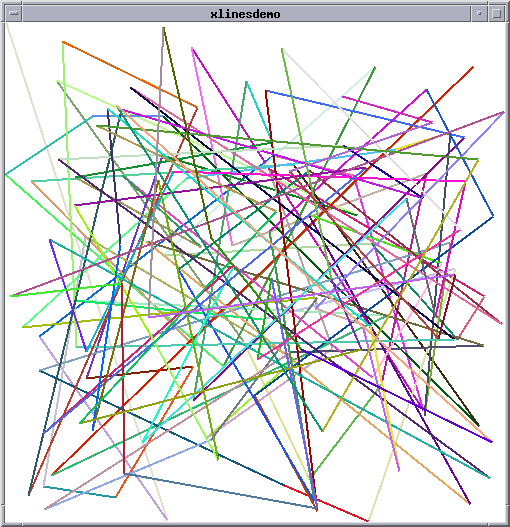
xlinesdemo
- is a simple demo of the X11 capabilities. A good place to start if you are learning dtksh.
$ ./xlinesdemo
Also see:
xlinedemo - a simple X11 demo of a moving line.
xcolourdemo - a simple X11 demo of the available colours.