

This week I spoke at LinuxCon North America 2014 in Chicago, which was also my first LinuxCon. I really enjoyed the conference, and it was a privilege to take part and contribute. I'll be returning to work with some useful ideas from talks and talking with attendees.
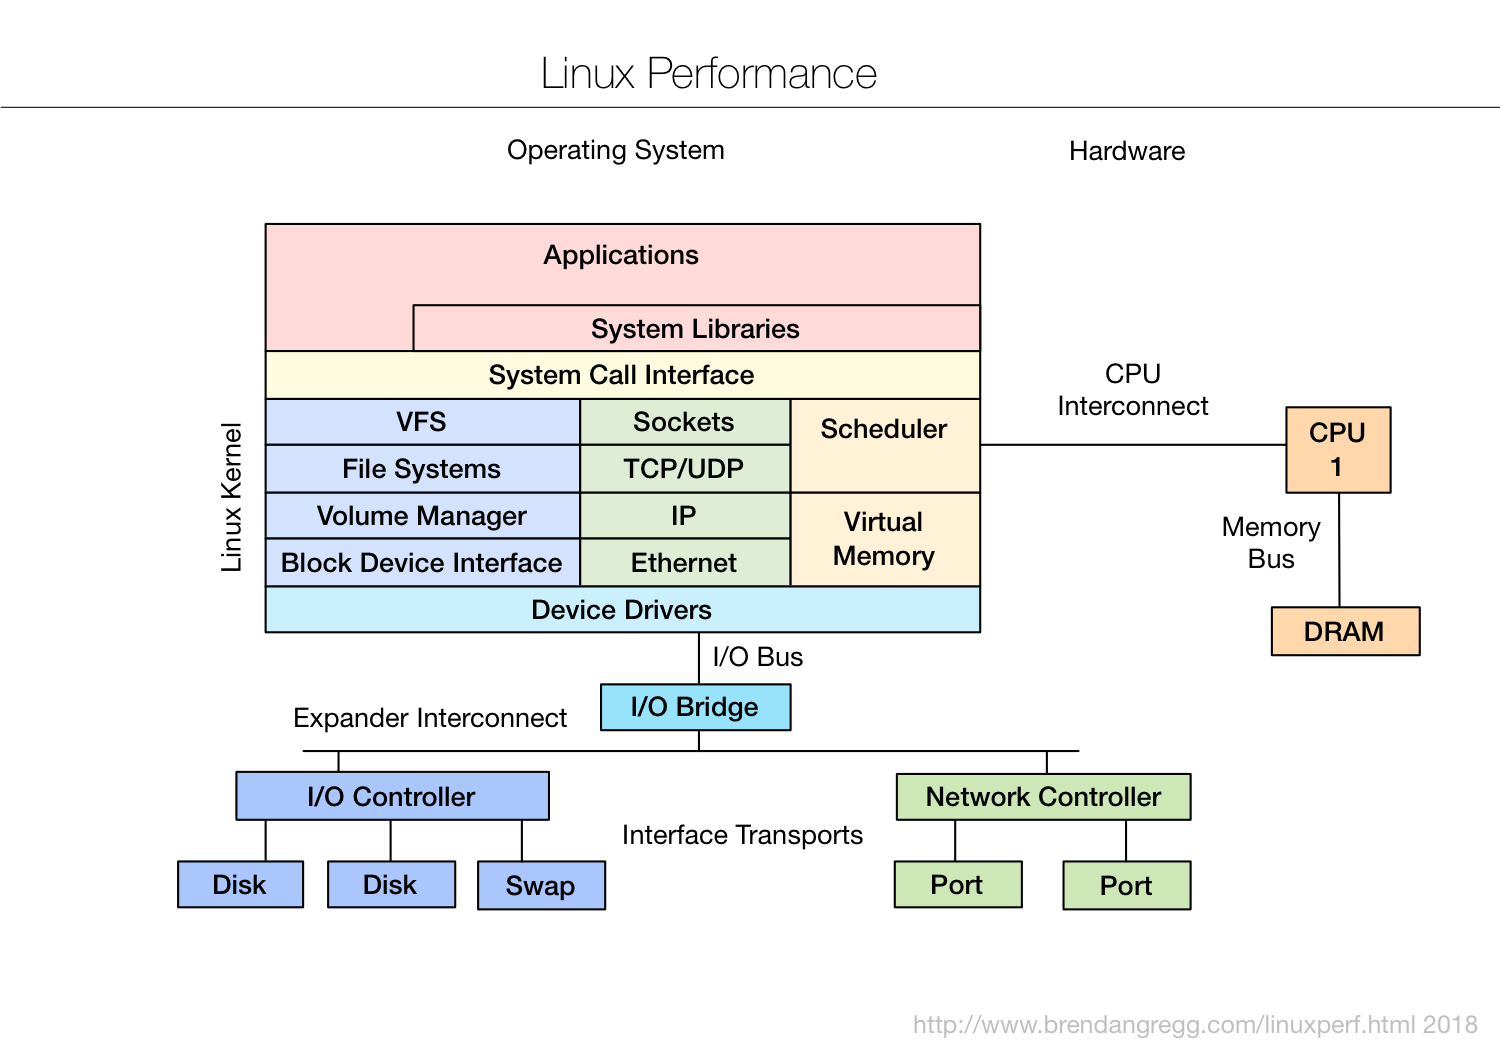
I included my latest Linux performance observability tools diagram, which I keep updated here:

But I was really excited to share some new diagrams, which are all in the slides:
I gave a similar talk two years ago at SCaLE11x, where I covered performance observability tools. This time, I covered observability, benchmarking, and tuning tools, providing a more complete picture of the performance tools landscape. I hope these help you in a similar way, when you move from observability to performing load tests with benchmarks, and finally tuning the system.
I also presented an updated summary on the state of tracing, after my recent discoveries with ftrace, which is able to serve some tracing needs in existing kernels. For more about ftrace, see my lwn.net article Ftrace: The hidden light switch, which was made open the same day as my talk.
At one point I included a blank template for observability tools (PNG):
My suggestion was to print this out and fill it in with whatever observability tools make most sense in your environment. This may include monitoring tools, both in-house and commercial, and can be supplemented by the server tools from my diagram above.
At Netflix, we have our own monitoring system to observe our thousands of cloud instances, and this diagram helps to see which Linux and server components it currently measures, and what can be developed next. (This monitoring tool also includes many application metrics.) As I said in the talk, we'll sometimes need to login to an instance using ssh, and run the regular server tools.
This diagram may also help you develop your own monitoring tools, by showing what would ideally be observed. It can also help rank commercial products: next time a salesperson tells you their tool can see everything, hand them this diagram and a pen. :-)
My talk was standing room only, and some people couldn't get in the room and missed out. Unfortunately, it wasn't videoed, either. Sorry, I should have figured this out sooner and arranged something in time. Given how popular it was, I suspect I'll give it again some time, and will hopefully get it on video.
Thanks to those who attended, and the Linux Foundation for having me and organizing a great event!
Click here for Disqus comments (ad supported).