

These are rough notes.
A service team was debugging a performance issue and noticed it coincided with a high rate of paging. I was asked to help, and used a variety of Linux performance tools to solve this including those that use eBPF and Ftrace. This is a rough post to share this old but good case study of using these tools, and to help justify their further development. No editing, spell checking, or comments. Mostly screenshots.
1. Problem Statement
The microservice managed and processed large files, including encrypting them and then storing them on S3. The problem was that large files, such as 100 Gbytes, seemed to take forever to upload. Hours. Smaller files, as large as 40 Gbytes, were relatively quick, only taking minutes.
A cloud-wide monitoring tool, Atlas, showed a high rate of paging for the larger file uploads:
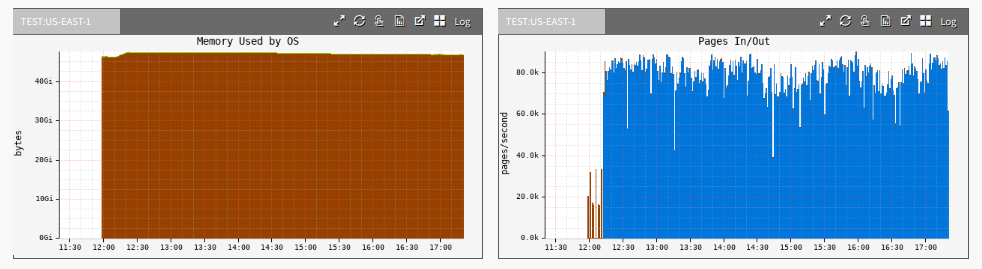
The blue is pageins (page ins). Pageins are a type of disk I/O where a page of memory is read in from disk, and are normal for many workloads.
You might be able to guess the issue from the problem statement alone.
2. iostat
Starting with my 60-second performance checklist, the iostat(1) tool showed a high rate of disk I/O during a large file upload:
# iostat -xz 1
Linux 4.4.0-1072-aws (xxx)  12/18/2018  _x86_64_    (16 CPU)

avg-cpu:  %user   %nice %system %iowait  %steal   %idle
           5.03    0.00    0.83    1.94    0.02   92.18

Device:         rrqm/s   wrqm/s     r/s     w/s    rkB/s    wkB/s avgrq-sz avgqu-sz   await r_await w_await  svctm  %util
xvda              0.00     0.29    0.21    0.17     6.29     3.09    49.32     0.00   12.74    6.96   19.87   3.96   0.15
xvdb              0.00     0.08   44.39    9.98  5507.39  1110.55   243.43     2.28   41.96   41.75   42.88   1.52   8.25

avg-cpu:  %user   %nice %system %iowait  %steal   %idle
          14.81    0.00    1.08   29.94    0.06   54.11

Device:         rrqm/s   wrqm/s     r/s     w/s    rkB/s    wkB/s avgrq-sz avgqu-sz   await r_await w_await  svctm  %util
xvdb              0.00     0.00  745.00    0.00 91656.00     0.00   246.06    25.32   33.84   33.84    0.00   1.35 100.40

avg-cpu:  %user   %nice %system %iowait  %steal   %idle
          14.86    0.00    0.89   24.76    0.06   59.43

Device:         rrqm/s   wrqm/s     r/s     w/s    rkB/s    wkB/s avgrq-sz avgqu-sz   await r_await w_await  svctm  %util
xvdb              0.00     0.00  739.00    0.00 92152.00     0.00   249.40    24.75   33.49   33.49    0.00   1.35 100.00

avg-cpu:  %user   %nice %system %iowait  %steal   %idle
          14.95    0.00    0.89   28.75    0.06   55.35

Device:         rrqm/s   wrqm/s     r/s     w/s    rkB/s    wkB/s avgrq-sz avgqu-sz   await r_await w_await  svctm  %util
xvdb              0.00     0.00  734.00    0.00 91704.00     0.00   249.87    24.93   34.04   34.04    0.00   1.36 100.00

avg-cpu:  %user   %nice %system %iowait  %steal   %idle
          14.54    0.00    1.14   29.40    0.06   54.86

Device:         rrqm/s   wrqm/s     r/s     w/s    rkB/s    wkB/s avgrq-sz avgqu-sz   await r_await w_await  svctm  %util
xvdb              0.00     0.00  750.00    0.00 92104.00     0.00   245.61    25.14   33.37   33.37    0.00   1.33 100.00

^C
I'm looking at the r_await column in particular: the average wait time for reads in milliseconds. Reads usually have apps waiting on them; writes may not (write-back caching). An r_wait of 33 ms is kinda high, and likely due to the queueing (avgqu-sz). They are largeish I/O, about 128 Kbytes (divide rkB/s by r/s).
3. biolatency
From bcc, this eBPF tool shows a latency histogram of disk I/O. I'm running it in case the averages are hiding outliers, which could be a device issue:
# /usr/share/bcc/tools/biolatency -m
Tracing block device I/O... Hit Ctrl-C to end.
^C
     msecs               : count     distribution
         0 -> 1          : 83       |                                        |
         2 -> 3          : 20       |                                        |
         4 -> 7          : 0        |                                        |
         8 -> 15         : 41       |                                        |
        16 -> 31         : 1620     |*******                                 |
        32 -> 63         : 8139     |****************************************|
        64 -> 127        : 176      |                                        |
       128 -> 255        : 95       |                                        |
       256 -> 511        : 61       |                                        |
       512 -> 1023       : 93       |                                        |
This doesn't look too bad. Most I/O are between 16 and 127 ms. Some outliers reaching the 0.5 to 1.0 second range, but again, there's quite a bit of queueing here seen in the earlier iostat(1) output. I don't think this is a device issue. I think it's the workload.
4. bitesize
As I think it's a workload issue, I want a better look at the I/O sizes in case there's something odd:
# /usr/share/bcc/tools/bitesize
Tracing... Hit Ctrl-C to end.
^C
Process Name = java
     Kbytes              : count     distribution
         0 -> 1          : 0        |                                        |
         2 -> 3          : 0        |                                        |
         4 -> 7          : 0        |                                        |
         8 -> 15         : 31       |                                        |
        16 -> 31         : 15       |                                        |
        32 -> 63         : 15       |                                        |
        64 -> 127        : 15       |                                        |
       128 -> 255        : 1682     |****************************************|
The I/O is mostly in the 128 to 255 Kbyte bucket, as expected from the iostat(1) output. Nothing odd here.
5. free
Also from the 60-second checklist:
# free -m
              total        used        free      shared  buff/cache   available
Mem:          64414       15421         349           5       48643       48409
Swap:             0           0           0
There's not much memory left, 349 Mbytes, but more interesting is the amount in the buffer/page cache: 48,643 Mbytes (48 Gbytes). This is a 64-Gbyte memory system, and 48 Gbytes is in the page cache (the file system cache).
Along with the numbers from the problem statement, this gives me a theory: Do the 100-Gbyte files bust the page cache, whereas 40-Gbyte files fit?
6. cachestat
cachestat is an experimental tool I developed that uses Ftrace and has since been ported to bcc/eBPF. It shows statistics for the page cache:
# /apps/perf-tools/bin/cachestat
Counting cache functions... Output every 1 seconds.
    HITS   MISSES  DIRTIES    RATIO   BUFFERS_MB   CACHE_MB
    1811      632        2    74.1%           17      48009
    1630    15132       92     9.7%           17      48033
    1634    23341       63     6.5%           17      48029
    1851    13599       17    12.0%           17      48019
    1941     3689       33    34.5%           17      48007
    1733    23007      154     7.0%           17      48034
    1195     9566       31    11.1%           17      48011
[...]
This shows many cache misses, with a hit ratio varying between 6.5 and 74%. I usually like to see that in the upper 90's. This is "cache busting." The 100 Gbyte file doesn't fit in the 48 Gbytes of page cache, so we have many page cache misses that will cause disk I/O and relatively poor performance.
The quickest fix is to move to a larger-memory instance that does fit 100 Gbyte files. The developers can also rework the code with the memory constraint in mind to improve performance (e.g., processing parts of the file, instead of making multiple passes over the entire file).
7. Smaller File Test
For further confirmation, I collected the same outputs for a 32 Gbyte file upload.
cachestat shows a ~100% cache hit ratio:
# /apps/perf-tools/bin/cachestat
Counting cache functions... Output every 1 seconds.
    HITS   MISSES  DIRTIES    RATIO   BUFFERS_MB   CACHE_MB
   61831        0      126   100.0%           41      33680
   53408        0       78   100.0%           41      33680
   65056        0      173   100.0%           41      33680
   65158        0       79   100.0%           41      33680
   55052        0      107   100.0%           41      33680
   61227        0      149   100.0%           41      33681
   58669        0       71   100.0%           41      33681
   33424        0       73   100.0%           41      33681
^C
This smaller size allows the service to process the file (however many passes it takes) entirely from memory, without re-reading it from disk.
free(1) shows it fitting in the page cache:
# free -m
              total        used        free      shared  buff/cache   available
Mem:          64414       18421       11218           5       34773       45407
Swap:             0           0           0
And iostat(1) shows little disk I/O, as expected:
# iostat -xz 1
Linux 4.4.0-1072-aws (xxx)  12/19/2018  _x86_64_    (16 CPU)

avg-cpu:  %user   %nice %system %iowait  %steal   %idle
          12.25    0.00    1.24    0.19    0.03   86.29

Device:         rrqm/s   wrqm/s     r/s     w/s    rkB/s    wkB/s avgrq-sz avgqu-sz   await r_await w_await  svctm  %util
xvda              0.00     0.32    0.31    0.19     7.09     4.85    47.59     0.01   12.58    5.44   23.90   3.09   0.15
xvdb              0.00     0.07    0.01   11.13     0.10  1264.35   227.09     0.91   82.16    3.49   82.20   2.80   3.11

avg-cpu:  %user   %nice %system %iowait  %steal   %idle
          57.43    0.00    2.95    0.00    0.00   39.62

Device:         rrqm/s   wrqm/s     r/s     w/s    rkB/s    wkB/s avgrq-sz avgqu-sz   await r_await w_await  svctm  %util

avg-cpu:  %user   %nice %system %iowait  %steal   %idle
          53.50    0.00    2.32    0.00    0.00   44.18

Device:         rrqm/s   wrqm/s     r/s     w/s    rkB/s    wkB/s avgrq-sz avgqu-sz   await r_await w_await  svctm  %util
xvdb              0.00     0.00    0.00    2.00     0.00    19.50    19.50     0.00    0.00    0.00    0.00   0.00   0.00

avg-cpu:  %user   %nice %system %iowait  %steal   %idle
          39.02    0.00    2.14    0.00    0.00   58.84

Device:         rrqm/s   wrqm/s     r/s     w/s    rkB/s    wkB/s avgrq-sz avgqu-sz   await r_await w_await  svctm  %util
[...]
8. Final Notes
cachestat was the killer tool here, but I should stress that it's still experimental. I wrote it for Ftrace with the constraints that it must be low-overhead and use the Ftrace function profiler only. As I mentioned in my LSFMMBPF 2019 keynote in Puerto Rico, where the Linux mm kernel engineers were present, I think the cachestat statistics are so commonly needed that they should be in /proc and not need my experimental tool. They pointed out challenges with providing them properly, and I think any robust solution is going to need their help and expertise. I hope this case study helps show why it is useful and worth the effort.
Until the kernel does support page cache statistics (which may be never: they are hot-path, so adding counters isn't free) we can use my cachestat tool, even if it does require frequent maintenance to keep working.