

In Linux 4.5 there was an enhancement to Linux perf_events (aka "perf") that reduces the CPU cost of flame graph generation. It's "-g folded". If you're automating flame graph generation, you might want to consider using this post Linux 4.5 (at least, until BPF improves this even further post 4.6).
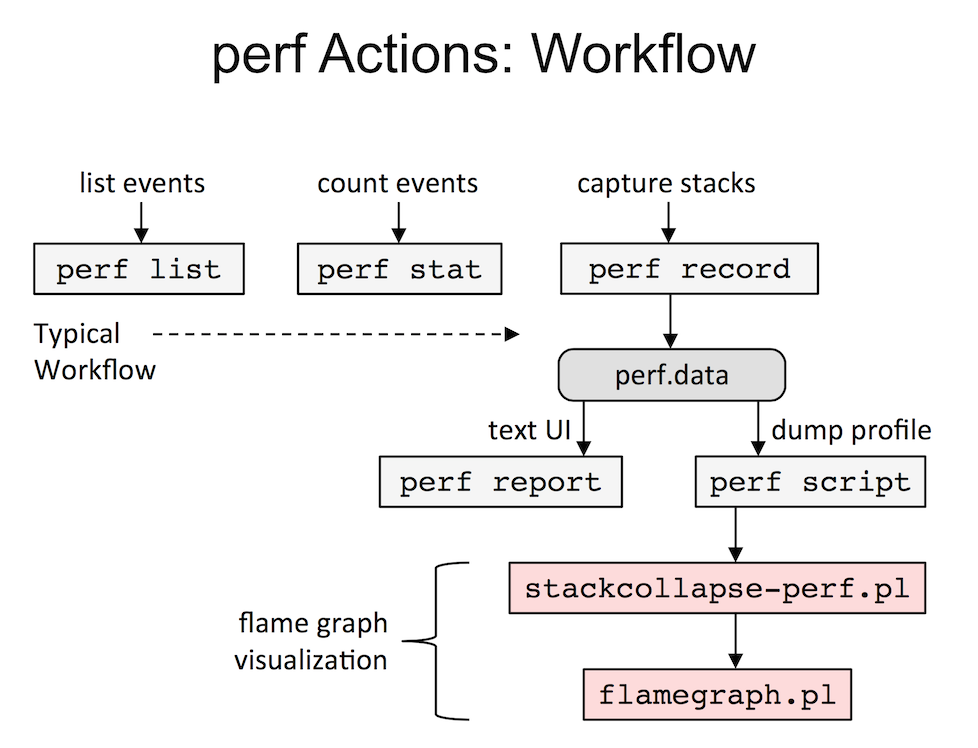
Flame graphs are a hierarchal visualization for profiled stack traces, and I described them in the recent ACMQ article The Flame Graph. The original implementation (on github) has a Perl program that accepts a "folded" format of stack trace profiles, which has a stack trace on a single line separated by semicolons, and then a value (usually frequency count of the stack trace). There are converters for different profilers, including stackcollapse-perf.pl for Linux perf_events.
I summarized this flame graph generation sequence in my SCALE13x presentation, shown on the right. Since the "perf" command can output profile data in different ways, can't it just emit folded format directly, eliminating the need for reprocessing in stackcollapse-perf.pl? It's not ideal, since we still must dump each event via perf.data and reprocess in user space (instead of aggregating in kernel space, which BPF will do later on), but it would be a big improvement.
Namhyung Kim has implemented a "folded" output mode for perf report for this purpose, and it has been integrated in Linux 4.5. I'll show you how it works.
Here's the usual output of perf report -n --stdio:
# perf report -n --stdio
[...]
# Children      Self       Samples  Command        Shared Object               Symbol
# ........  ........  ............  .............  ..........................  .............................................
#
    29.39%     0.00%             0  bash           [kernel.vmlinux]            [k] return_from_SYSCALL_64
            |
            ---return_from_SYSCALL_64
               |
                --29.38%--do_syscall_64
                          |
                          |--18.60%--sys_execve
                          |          |
                          |           --18.54%--do_execveat_common.isra.36
                          |                     |
                          |                     |--15.90%--search_binary_handler
                          |                     |          |
                          |                     |           --15.84%--load_elf_binary
                          |                     |                     |
[...]
As an aside: if you're looking at this and scratching your head, you should know about another recent change to perf: switching from callee to caller order by default. Here's the old style (specified using -g callee):
# perf report -n --stdio -g callee
[...]
    15.85%     0.03%            32  bash           [kernel.vmlinux]            [k] load_elf_binary
            |
            ---load_elf_binary
               |
                --15.84%--search_binary_handler
                          do_execveat_common.isra.36
                          sys_execve
                          do_syscall_64
                          return_from_SYSCALL_64
                          __execve

    15.29%     0.03%            32  bash           [kernel.vmlinux]            [k] flush_old_exec
            |
            ---flush_old_exec
               |
                --15.28%--load_elf_binary
                          search_binary_handler
                          do_execveat_common.isra.36
                          sys_execve
                          do_syscall_64
                          return_from_SYSCALL_64
I digress. (We did discuss this change on lkml.)
With the new output mode, folded, we can now do this:
# perf report --stdio --no-children -n -g folded,0,caller,count -s comm
[...]
# Overhead       Samples  Command
# ........  ............  .............
#
    60.43%         72372  bash
10282 0x436fd
6378 make_child;__libc_fork;return_from_SYSCALL_64;do_syscall_64;sys_clone;_do_fork;copy_process.part.30;copy_page_range
5944 __execve;return_from_SYSCALL_64;do_syscall_64;sys_execve;do_execveat_common.isra.36;search_binary_handler;load_elf_binary;flush_old_exec;mmput;exit_mmap;unmap_vmas;unma
p_single_vma;unmap_page_range
3207 __execve;return_from_SYSCALL_64;do_syscall_64;sys_execve;do_execveat_common.isra.36;search_binary_handler;load_elf_binary;flush_old_exec;mmput;exit_mmap;unmap_vmas;unma
p_single_vma;unmap_page_range;page_remove_rmap
2746 __execve;return_from_SYSCALL_64;do_syscall_64;sys_execve;do_execveat_common.isra.36;search_binary_handler;load_elf_binary;flush_old_exec;mmput;exit_mmap;tlb_finish_mmu;
tlb_flush_mmu_free;free_pages_and_swap_cache;release_pages
1059 __execve;return_from_SYSCALL_64;do_syscall_64;sys_execve;do_execveat_common.isra.36;copy_strings.isra.26;strnlen_user
[...]
    37.44%         44842  date
2462 0x401f0fc3f30678;_dl_addr
1639 entry_SYSCALL_64_fastpath;0x27e154;do_group_exit;do_exit;mmput;exit_mmap;unmap_vmas;unmap_single_vma;unmap_page_range
1153 do_lookup_x
1032 entry_SYSCALL_64_fastpath;0x27e154;do_group_exit;do_exit;mmput;exit_mmap;unmap_vmas;unmap_single_vma;unmap_page_range;page_remove_rmap
796 _dl_sysdep_start;dl_main;_dl_relocate_object
646 entry_SYSCALL_64_fastpath;0x27e154;do_group_exit;do_exit;mmput;exit_mmap;tlb_finish_mmu;tlb_flush_mmu_free;free_pages_and_swap_cache;release_pages
481 entry_SYSCALL_64_fastpath;0x27e154;do_group_exit;do_exit
And with a touch of awk:
# perf report --stdio --no-children -n -g folded,0,caller,count -s comm | \
    awk '/^ / { comm = $3 } /^[0-9]/ { print comm ";" $2, $1 }' | more
bash;0x436fd 10282
bash;make_child;__libc_fork;return_from_SYSCALL_64;do_syscall_64;sys_clone;_do_fork;copy_process.part.30;copy_page_range 6378
bash;__execve;return_from_SYSCALL_64;do_syscall_64;sys_execve;do_execveat_common.isra.36;search_binary_handler;load_elf_binary;flush_old_exec;mmput;exit_mmap;unmap_vmas;unma
p_single_vma;unmap_page_range 5944
bash;__execve;return_from_SYSCALL_64;do_syscall_64;sys_execve;do_execveat_common.isra.36;search_binary_handler;load_elf_binary;flush_old_exec;mmput;exit_mmap;unmap_vmas;unma
p_single_vma;unmap_page_range;page_remove_rmap 3207
bash;__execve;return_from_SYSCALL_64;do_syscall_64;sys_execve;do_execveat_common.isra.36;search_binary_handler;load_elf_binary;flush_old_exec;mmput;exit_mmap;tlb_finish_mmu;
tlb_flush_mmu_free;free_pages_and_swap_cache;release_pages 2746
[...]
This is the folded format that flamegraph.pl wants, and can be piped directly into flamegraph.pl.
As for CPU cost, here's the old way:
# time (perf script | ./FlameGraph/stackcollapse-perf.pl > /dev/null)

real    0m4.659s
user    0m7.644s
sys     0m1.355s
Versus the new:
# time (perf report --stdio --no-children -n -g folded,0,caller,count -s comm | awk '/^ / { comm = $3 } /^[0-9]/ { print comm ";" $2, $1 }' > /dev/null)

real    0m4.235s
user    0m3.006s
sys     0m1.269s
The run time didn't change much, but the CPU cost (user + sys) did, from 9.0 seconds to 4.3, for this example. (The run time is lower than CPU time because the first example ran multi-threaded.) Thanks Namhyung!
Linux 4.6 should improve this a lot more, as BPF included support for stack traces (BPF_MAP_TYPE_STACK_TRACE), allowing them to be frequency counted in kernel context.
Click here for Disqus comments (ad supported).