

The Working Set Size (WSS) is how much memory an application needs to keep working. Your app may have populated 100 Gbytes of main memory, but only uses 50 Mbytes each second to do its job. That's the working set size. It is used for capacity planning and scalability analysis.
You may never have seen WSS measured by any tool (I haven't either). OSes usually show you virtual memory and resident memory, shown as the "VIRT" and "RES" columns in top. Resident memory is real memory: main memory that has been allocated and page mapped. But we don't know how much of that is in heavy use, which is what WSS tells us.
In this post I'll introduce some new things I've developed for WSS estimation: two Linux tools, and WSS profile charts. The tools use either the referenced or the idle page flags to measure a page-based WSS, and were developed out of necessity for another performance problem.
Method 1: Referenced Page Flag
This uses a kernel feature added in Linux 2.6.22: the ability to set and read the referenced page flag from user space, added for analyzing memory usage. I just wrote wss.pl as a front-end to this feature. Here is a MySQL database server (mysqld), PID 423, and measuring its working set size for 0.1 seconds (100 milliseconds):
# ./wss.pl 423 0.1
Watching PID 423 page references during 0.1 seconds...
Est(s)     RSS(MB)    PSS(MB)    Ref(MB)
0.107       403.66     400.59      28.02
In 100 ms, mysqld touched 28 Mbytes worth of pages, out of its 404 Mbytes of total main memory. Why did I use a 100 ms interval? Short durations can be useful for understanding how well a WSS will fit into the CPU caches (L1/L2/L3, TLB L1/L2, etc). In this case, 28 Mbytes is a little larger than the LLC for this CPU, so may not cache so well (in a single LLC, anyway, and based on this single measurement).
The tool also has a cumulative mode (-C), which resets the referenced flags once then takes continuous measurements. Eg, once per second:
# ./wss.pl -C `pgrep -n mysqld` 1
Watching PID 423 page references grow, output every 1 seconds...
Est(s)     RSS(MB)    PSS(MB)    Ref(MB)
1.012       403.66     400.60      86.30
2.032       403.66     400.60      90.62
3.052       403.66     400.60      93.79
4.072       403.66     400.60      96.86
5.092       403.66     400.67     102.36
[...]
This lets you watch WSS grow.
The columns are:
- Est(s): Estimated WSS measurement duration: this accounts for delays with scanning pagemap data.
- RSS(MB): Resident Set Size (Mbytes). The main memory size.
- PSS(MB): Proportional Set Size (Mbytes). Accounting for shared pages.
- Ref(MB): Referenced (Mbytes) during the specified duration. This is the working set size metric.
For large processes (>100 Gbytes), the delays in setting and reading pagemap data can be large, so I've added the Est(s) column to better reflect the real span of the WSS measurement.
How it works
My wss.pl tool works by resetting a "referenced" flag on memory pages, and then checking later to see how many pages this flag returned to. I'm reminded of the old Unix page scanner, which would use a similar approach to find not-recently-used pages that are eligible for paging to the swap device (aka swapping). The referenced flag is really the "accessed" bit in the page table entry (PTE) which the processor normally updates anyway, and which can be read and cleared by the kernel (it's _PAGE_ACCESSED in Linux). My tool does this using /proc/PID/clear_refs and the Referenced value from /proc/PID/smaps, which were added in 2007 by David Rientjes (thanks). He also described memory footprint estimation in his patch.
I've only seen one other description of this feature: How much memory am I really using?, by Jonathan Corbet (lwn.net editor). I'd categorize this as an experimental approach, as it modifies the state of the system: changing referenced page flags.
WARNINGs
This tool uses /proc/PID/clear_refs and /proc/PID/smaps, which can cause slightly higher application latency (eg, 10%) while the kernel walks page structures. For large processes (> 100 Gbytes) this duration of higher latency can last over 1 second, during which this tool is consuming system CPU time. Consider these overheads. This also resets the referenced flag, which might confuse the kernel as to which pages to reclaim, especially if swapping is active. This also activates some old kernel code that may not have been used in your environment before, and which modifies page flags: I'd guess there is a risk of an undiscovered kernel panic (the Linux mm community may be able to say how real this risk is). Test in a lab environment for your kernel versions, and consider this experimental: use at your on risk.
See the later section for a somewhat safer approach using the idle page flag on Linux 4.3+, which also tracks unmapped file I/O memory.
WSS profile charts
The wss.pl tool has a profile mode (-P) for stepping up measurements by a power-of-two:
# ./wss.pl -P 16 `pgrep -n mysqld` 0.001
Watching PID 423 page references grow, profile beginning with 0.001 seconds, 16 steps...
Est(s)     RSS(MB)    PSS(MB)    Ref(MB)
0.008       403.66     400.76       8.79
0.018       403.66     400.76      13.98
0.027       403.66     400.76      17.69
0.038       403.66     400.76      21.70
0.058       403.66     400.76      27.83
0.088       403.66     400.76      35.51
0.128       403.66     400.76      43.43
0.209       403.66     400.76      55.08
0.349       403.66     400.76      69.95
0.620       403.66     400.76      84.18
1.150       403.66     400.76      86.18
2.190       403.66     400.76      89.43
4.250       403.66     400.76      94.41
8.360       403.66     400.76     101.38
16.570      403.66     400.76     107.49
32.980      403.66     400.76     113.05
This provides information for different uses of WSS: short durations for studying WSS CPU caching, and long durations for studying main memory residency. Since workloads can vary, note that this is just showing WSS growth for the time that the tool was run. You might want to collect this several times to determine what a normal WSS profile looks like.
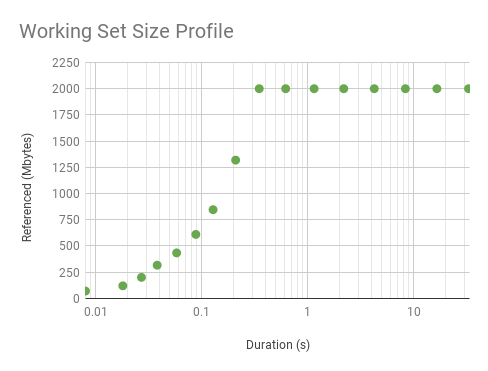
Graphing the above profile as a scatter plot, along with results from a microbenchmark with a uniform access distribution of 100 Mbytes:
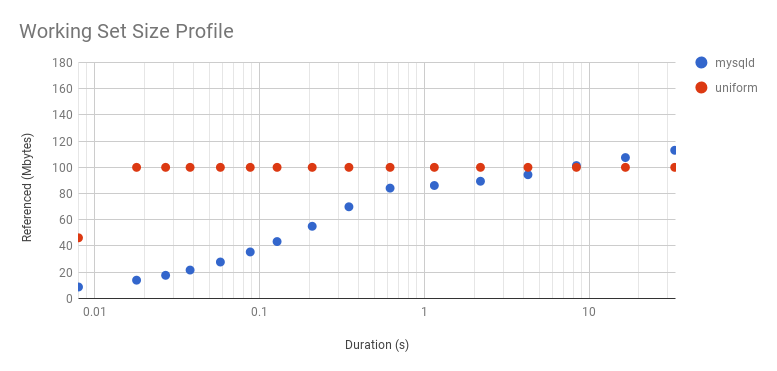
The microbenchmark shows a steady WSS of 100 Mbytes, with the exception of the first point: that was so quickly that the program didn't have enough time to touch its whole WSS. It's interesting to explore this in more detail by increasing the WSS to 2 Gbytes:
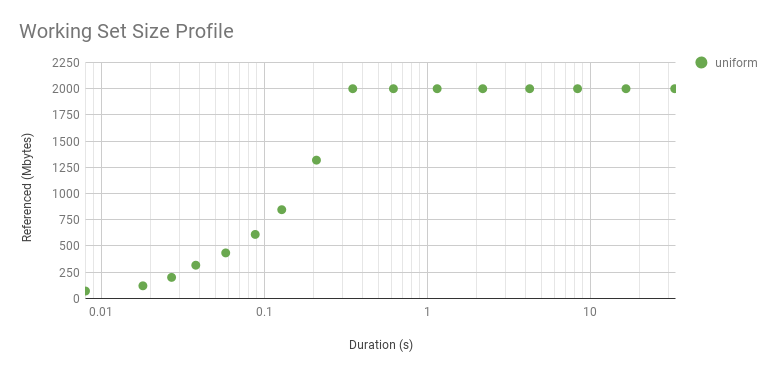
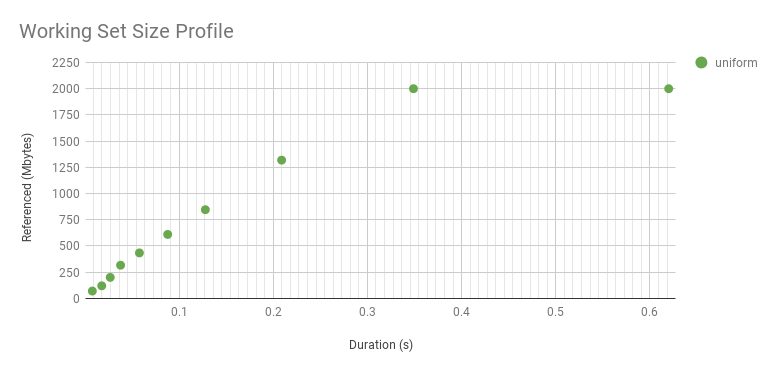
It curves upwards because it's a log axis. Here is linear. While it looks interesting, this curve is just reflecting the WSS sample duration rather than the access distribution. The distribution really is uniform, as seen by the flat line after about 0.3 s. The knee point in this graph shows the minimum interval we can identify a uniform access distribution, for this WSS and program logic. The profile beyond this point reflects the access distribution, and is interesting for understanding main memory usage. The profile before it is interesting for a different reason: understanding the workload that the CPU caches process over short intervals.
Method 2: Idle Page Flag
This is a newer approach added in Linux 4.3 by Vladimir Davydov, which introduces Idle and Young page flags for more reliable working set size analysis, and without drawbacks like mucking with the referenced flag which could confuse the kernel reclaim logic. Jonathan Corbet has again written about this topic: Tracking actual memory utilization. This is still a PTE accessed-bit approach: these extra idle and young flags are only in the kernel's extended page table entry (page_ext_flags), and are used to help the reclaim logic.
It's a bit more involved to use. From the kernel documentation vm/idle_page_tracking.txt:
That said, in order to estimate the amount of pages that are not used by a
workload one should:

 1. Mark all the workload's pages as idle by setting corresponding bits in
    /sys/kernel/mm/page_idle/bitmap. The pages can be found by reading
    /proc/pid/pagemap if the workload is represented by a process, or by
    filtering out alien pages using /proc/kpagecgroup in case the workload is
    placed in a memory cgroup.

 2. Wait until the workload accesses its working set.

 3. Read /sys/kernel/mm/page\_idle/bitmap and count the number of bits set. If
    one wants to ignore certain types of pages, e.g. mlocked pages since they
    are not reclaimable, he or she can filter them out using /proc/kpageflags.
I've written two proof-of-concept tools that use this, which are in wss. I'll show them analyze the same 20 Gbyte process, along with wss.pl:
# ./wss-v1 27357 0.01
Watching PID 27357 page references during 0.01 seconds...
Est(s)     Ref(MB)
44.571       16.00

# ./wss-v2 27357 0.01
Watching PID 27357 page references during 0.01 seconds...
Est(s)     Ref(MB)
0.806        15.00

# ./wss.pl 27357 0.01
Watching PID 27357 page references during 0.01 seconds...
Est(s)     RSS(MB)    PSS(MB)    Ref(MB)
0.080     20001.12   20000.14      15.03
wss-v1 works page-by-page, similar to the steps described in idle_page_tracking.txt. Unfortunately, this means millions of syscalls to read the process pagemap for PFN translations, then the idle bitmap for each page. It's good for small processes, but not large ones like this 20 Gbyte example. The estimated span of measurement was 44 seconds (the run time was double that).
wss-v2 copies the process pagemap segments and the entire system idle bitmap into memory, and then operates on those. (mmap would be even quicker, but isn't currently supported by those files.) This avoids millions of syscalls, reducing the time to 0.8 s. It's still far larger than our intended duration of 0.01 s. wss.pl gets closer, with a measurement of 0.08 s, as it uses fewer syscalls to write and read from clear_refs and smaps. Perhaps we should add an equivalent interface for the idle page flag: a /proc/PID/clear_idle and an Idle entry in smaps. Another addition I'd like is to be able to set all the bits in the idle bitmap, not just user pages, so that system-wide snapshots can be taken. Most systems I look after have one process consuming most of main memory: so I'd like to skip the process pagemap step and just study the idle map.
I did try a dangerous solution to the measurement span inflation: sending the process SIGSTOP and SIGCONT signals, so that it only ran during the intended WSS duration, and outside of that it was paused. This stops the WSS growing while we're reading page info. I say dangerous, since that approach can inject considerable latency to the application, over one second of paused time, which will play havoc with performance (kill TCP window sizes, timeout other operations) and may well change the system under test.
WARNINGs: Both wss-v1 and wss-v2 have warnings, listed in the README, similar to wss.pl (but without the reclaim logic warning).
And More
I've seen other ways to estimate the working set size, although each has its own caveats. What I haven't seen is a ready-baked tool for doing WSS estimation. This is what motivated me to write my wss tools, based on Linux referenced and idle page flags, although each tool has its own caveats described in this post (although not as bad as other approaches).
In the post I had originally discussed other methods of WSS estimation and included PMC analysis, but it was getting too long. I've moved the content to its own website: Working Set Size Estimation, which includes further discussion of the wss tools.
Click here for Disqus comments (ad supported).