

The private bpftrace repository has just been made public, which is big news for DTrace fans. Created by Alastair Robertson, bpftrace is an open source high-level tracing front-end that lets you analyze systems in custom ways. It's shaping up to be a DTrace version 2.0: more capable, and built from the ground up for the modern era of the eBPF virtual machine. eBPF (extended Berkeley Packet Filter) is in the Linux kernel and is the new hotness in systems engineering. It is being developed for BSD, too, where BPF originated.
Screenshot: tracing read latency for PID 181:
# bpftrace -e 'kprobe:vfs_read /pid == 30153/ { @start[tid] = nsecs; }
kretprobe:vfs_read /@start[tid]/ { @ns = hist(nsecs - @start[tid]); delete(@start[tid]); }'
Attaching 2 probes...
^C

@ns:
[256, 512)         10900 |@@@@@@@@@@@@@@@@@@@@@@@@@@@@@@                      |
[512, 1k)          18291 |@@@@@@@@@@@@@@@@@@@@@@@@@@@@@@@@@@@@@@@@@@@@@@@@@@@@|
[1k, 2k)            4998 |@@@@@@@@@@@@@@                                      |
[2k, 4k)              57 |                                                    |
[4k, 8k)             117 |                                                    |
[8k, 16k)             48 |                                                    |
[16k, 32k)           109 |                                                    |
[32k, 64k)             3 |                                                    |
Some one-liners:
# New processes with arguments
bpftrace -e 'tracepoint:syscalls:sys_enter_execve { join(args->argv); }'

# Files opened by process
bpftrace -e 'tracepoint:syscalls:sys_enter_open { printf("%s %s\n", comm, str(args->filename)); }'

# Syscall count by program
bpftrace -e 'tracepoint:raw_syscalls:sys_enter { @[comm] = count(); }'

# Syscall count by syscall
bpftrace -e 'tracepoint:syscalls:sys_enter_* { @[probe] = count(); }'

# Syscall count by process
bpftrace -e 'tracepoint:raw_syscalls:sys_enter { @[pid, comm] = count(); }'

# Read bytes by process:
bpftrace -e 'tracepoint:syscalls:sys_exit_read /args->ret/ { @[comm] = sum(args->ret); }'

# Read size distribution by process:
bpftrace -e 'tracepoint:syscalls:sys_exit_read { @[comm] = hist(args->ret); }'

# Disk size by process
bpftrace -e 'tracepoint:block:block_rq_issue { printf("%d %s %d\n", pid, comm, args->bytes); }'

# Pages paged in by process
bpftrace -e 'software:major-faults:1 { @[comm] = count(); }'

# Page faults by process
bpftrace -e 'software:faults:1 { @[comm] = count(); }'

# Profile user-level stacks at 99 Hertz, for PID 189:
bpftrace -e 'profile:hz:99 /pid == 189/ { @[ustack] = count(); }'
If they look familiar, they are from my old DTrace one-liners that I switched to bpftrace. It's also been a milestone to see these all work in bpftrace, which they now do! bpftrace has most of DTrace's capabilities and more.
bpftrace
The prior work that led to bpftrace (aka BPFtrace) is discussed my earlier DTrace for Linux 2016 post, which explains how the Linux kernel gained eBPF: the virtual machine that we're using to run tracing programs. That post covered the bcc front end (BPF Complier Collection), which has let me rewrite my DTraceToolkit tools. bcc is powerful but laborious to program. bpftrace is a complimentary addition that provides a high-level language for one-liners and short scripts.
Alastair recently developed struct support, and applied it to tracepoints (which is used by the above one-liners), and applied it to kprobes yesterday. That was the last major missing piece! Here's an example:
# cat path.bt
#include <linux/path.h>
#include <linux/dcache.h>

kprobe:vfs_open
{
    printf("open path: %s\n", str(((path *)arg0)->dentry->d_name.name));
}

# bpftrace path.bt
Attaching 1 probe...
open path: dev
open path: if_inet6
open path: retrans_time_ms
Myself, Willian Gaspar, and Mary Marchini, have been contributing other capabilities and bug fixes. For a list of the minor work left to do, see the issue list, and for what is done, see the reference guide and prior commits.
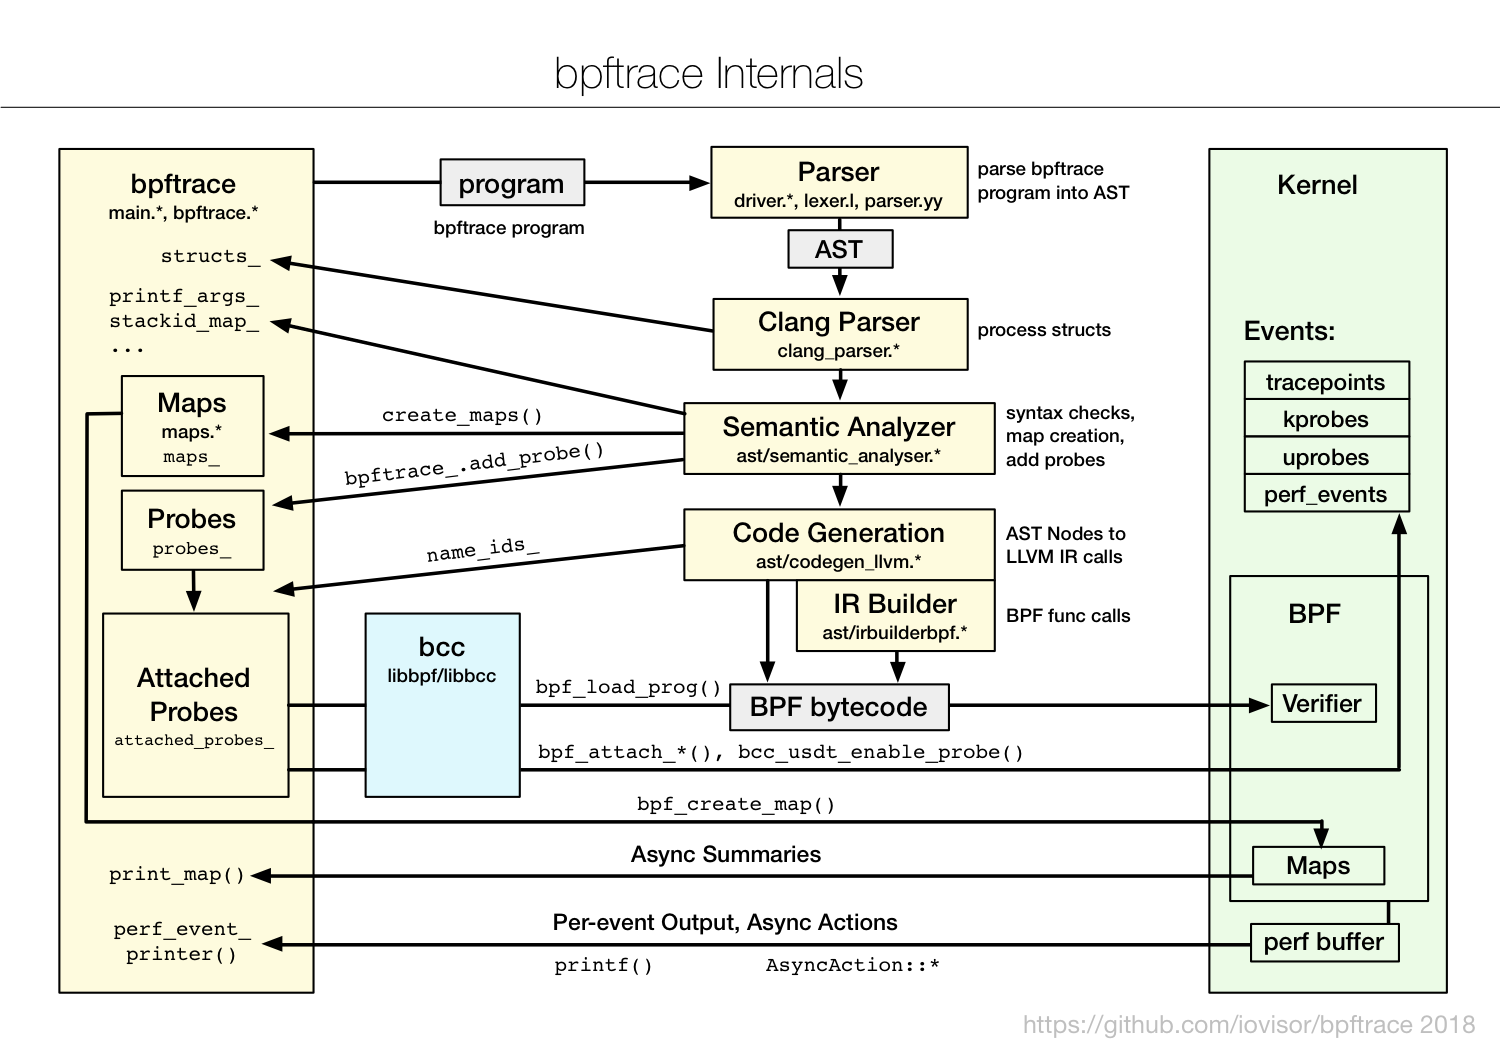
bpftrace uses existing Linux kernel facilities (eBPF, kprobes, uprobes, tracepoints, perf_events), as well as bcc libraries. Internally, bpftrace uses a lex/yacc parser to convert programs to AST, then llvm IR actions, then BPF.
To learn bpftrace, I've created a couple of references:
The one-liners tutorial is based on my FreeBSD DTrace Tutorial, and I think is a time-efficient way to learn bpftrace (as well as DTrace on FreeBSD).
Since I helped developed bpftrace, I'm aware of how fresh my own code is and how likely I introduced bugs. Might bpftrace SIGSEGV and coredump? Probably, let us know, we already fixed plenty of these. Might bpftrace spew incomprehensible LLVM or BPF verifier errors (with -v)? Probably, let us know. Might bpftrace panic the kernel? That's much less likely, since that component is eBPF which is now years old. What I'd expect is some user-level bugs where the bpftrace process crashes or gets stuck and needs to be killed. Lets us know on github, and if you can, please help fix them and the other issues. bpftrace has a test suite with over 200 tests.
bpftrace/eBPF vs DTrace equivalency
I'll show examples of bpftrace/eBPF vs DTrace in the sections that follow, but it's important to note that the eBPF engine was not created as a Linux version of DTrace. eBPF does more.
eBPF was created by Alexei Starovoitov while at PLUMgrid (he's now at Facebook) as a generic in-kernel virtual machine, with software defined networks as the primary use case. Observability is one of many other use cases, as is eXpress Data Path, container security and networking, iptables, infrared decoding, intrusion detection, hyperupcalls, and FUSE performance. eBPF is hard to use directly, so bcc was created as a Python front-end.
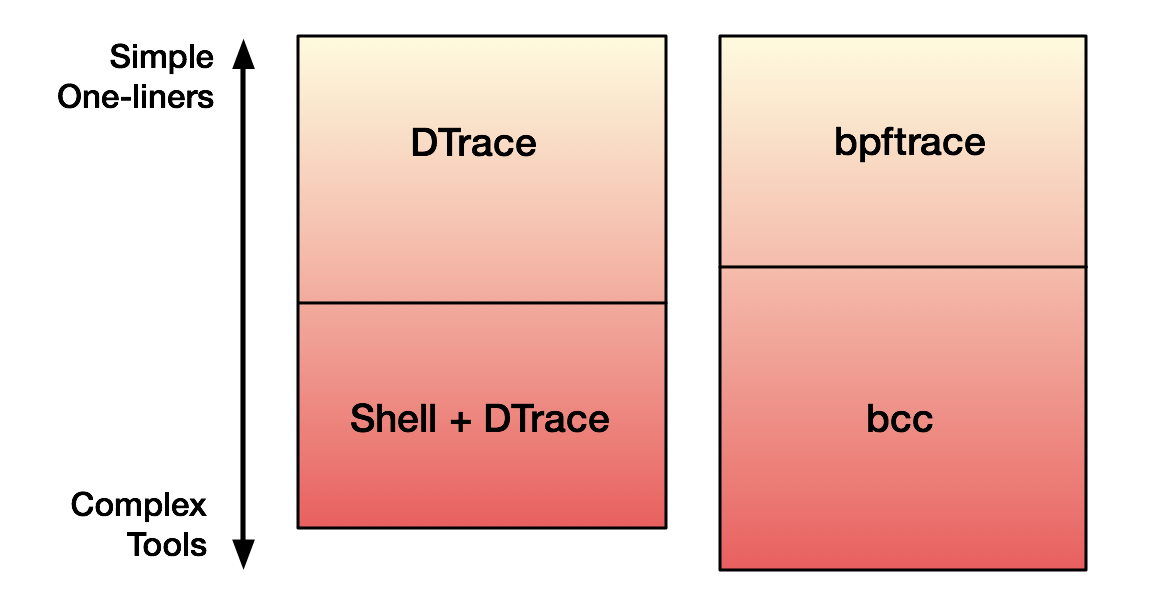
bpftrace was created as an even higher-level front end for custom ad-hoc tracing, and can serve a similar role as DTrace. We've been adding bpftrace features as we need them, not just because DTrace had them. I can think of over a dozen things that DTrace can do that bpftrace currently cannot, including custom aggregation printing, shell arguments, translators, sizeof(), speculative tracing, and forced panics. Some we may add as the need arises, but so far I haven't really needed them. And in some cases it's best left to bcc, rather than cluttering up bpftrace with niche functionality.
DTrace, too, lacked functionality like argument processing that I implemented elsewhere, in shell wrappers. Instead of augmenting bpftrace with shell wrappers, we can just switch to bcc, which can make use of any Python library (including argparse). This makes bpftrace and bcc complimentary. Visualizing this:
There's also a number of things that eBPF can do that DTrace can't, but one I want to mention is the ability to save and retrieve stack traces as variables. I've already used it with bpftrace to debug file descriptor leaks in production. Here's a tool that does this (fdleak.bt):
kretprobe:__alloc_fd
{
    $fd = retval;
    @alloc_stack[comm, pid, $fd] = ustack;
}

kprobe:__close_fd
{
    $fd = arg1;
    delete(@alloc_stack[comm, pid, $fd]);
}
The output shows user-level stacks that were allocated but not freed. It works by saving the stack on allocation, then deleting it on free. When bpftrace exits, it prints the left-overs in @alloc_stack: the stacks that weren't freed. I wrote a longer version that includes timestamps, so I can find the longer-term survivors. You can apply this technique to any object allocation, and whip up your own leak detection tools on the fly. With DTrace, this required dumping all stacks to a file and post-processing, which involved much higher overhead. eBPF can do it all in-kernel, and filter out potentially millions of objects that were allocated and freed quickly.
There's an even more important use case, which I showed in my off-wake time post, prior to bpftrace: saving waker stacks and associating them with sleeper stacks. It's hard to overstate how important this is. It makes off-CPU analysis effective, which is the counterpart to CPU analysis. The combination of CPU and off-CPU analysis means we have a way to attack any performance issue: a performance engineer's dream.
DTrace to bpftrace Cheatsheet
If you already know DTrace, it should take you ten minutes to learn the equivalents in bpftrace. Here's key differences as of August 2018:
| Type | DTrace | bpftrace |
|---|---|---|
| function | @ = quantize(value) | @ = hist(value) |
| function | @ = lquantize(value, min, max, step) | @ = lhist(value, min, max, step) |
| variable | this->name | $name |
| variable | self->name | @name[tid] |
| variable | name[key] | @name[key] |
| variable | global_name | @global_name |
| variable | self->name = 0 | delete(@name[tid]) |
| variable | curthread | curtask |
| variable | probeprov probemod probename | probe |
| provider | fbt::func:entry | kprobe:func |
| provider | fbt::func:return | kretprobe:func |
| provider | pid$target::func:entry | uprobe:func |
| provider | pid$target::func:return | uretprobe:func |
| provider | profile:::99 | profile:hz:99 |
| provider | profile:::tick-1sec | interval:s:1 |
This list doesn't cover the extra things that bpftrace can do, like access aggregation elements, do user-level tracing system wide, save stacks as variables, etc. See the reference guide for more details.
Script Comparison
I could pick scripts that minimize or maximize the differences, but either would be misleading. Here's a comparison for an average-sized DTraceToolkit script (seeksize.d) that uses common functionality.
This example shows that the overall script is similar. The major work in porting these scripts to Linux is not the syntax, but is the research and testing to find equivalent Linux tracepoints and their arguments. And that major work is irrespective of the tracing language.
Now that I ported it, I've found it little odd. I would have guessed that this answers the question: are the disks seeking? But it's really answering a tricker question: is an application causing the disks to seek? I wrote seeksize.d in 2004, so I have to think back to that time to understand it. Back then I could already tell if disks were seeking by interpreting iostat(1) output: seeing high disk latency but small I/O. What iostat(1) couldn't tell me is if it was due to competing applications using the disks, or if an application itself was applying a random workload. That's what I wrote seeksize.d to answer, an answer that directs further tuning: whether you need to separate applications on different disks, or tune one application's disk workload.
Why did this take so long?
I've spoken to many engineers and companies about finishing a high-level tracer for Linux. It's been an interesting case study of Linux vs commercial development. In summary, the reasons this took so long were:
1. Linux isn't a company
Scott McNealy, CEO of Sun Microsystems when DTrace was developed, was fond of the saying "all the wood behind one arrow". So much so, that staff once installed a giant arrow through his office window as an April fool's joke. In Linux, all effort hasn't been behind one tracing arrow, but split among 14 (SystemTap, LTTng, ftrace, perf_events, dtrace4linux, OEL DTrace, ktap, sysdig, Intel PIN, bcc, shark, ply, and bpftrace). If Linux was a company, management could consolidate overlapping projects and focus on one or two tracers. But it isn't.
2. Linux won
Linux dropped the ball on its own dynamic tracing implementation (DProbes in 2000), creating an opportunity for Sun to develop its own as a competitive feature. Sun had billions in revenue, and countless staff worked on making DTrace successful (including sales, marketing, educational services, etc.) That circumstance doesn't exist for Linux. Linux has already won, and there's no company offering any real resources to build a competitive tracer, with one exception: Red Hat.
3. Most funding went into SystemTap
Ask a RHEL customer about DTrace, and they may say they had it years ago: SystemTap. However, SystemTap never fully merged into the Linux kernel (parts did, like uprobes), so as an out-of-tree project it required maintenance to work at all, and Red Hat only did this for RHEL. Try complaining to Red Hat about this as an Ubuntu user: they'll often say "switch to RHEL". Can you blame them? Problem is, this was the only real money on the table to build a Linux DTrace (especially since Red Hat picked up the big ex-Sun accounts, who wanted DTrace), and it went into SystemTap.
4. Good-enough solutions
Another impediment has been good-enough solutions. Some companies have figured out how to get SystemTap (or LTTng or ftrace or perf) to work well enough, and are happy. Would they like eBPF/bcc/bpftrace finished? Sure. But they aren't going to help develop them, as they already have a good-enough solution. Some companies are happy enough using my ftrace perf-tools, or my bcc tools – so my own prior engineering work gives them a reason not to help build something better.
5. CTF/BTF
DTrace was built on Solaris, which already had Compact Type Format to provide the struct information it needed. Linux had DWARF and debuginfo, which unlike CTF, is not commonly installed. That has hindered developing a real DTrace-like tracer. Only recently, in the Linux 4.18 release, do we now have a CTF technology in Linux: BPF Type Format (BTF).
Default Install
It's worth mentioning that DTrace was a default install on Solaris. That really aided adoption, as customers didn't have a choice! Now imagine what it would take to make bpftrace a default install on all Linux distros. I think it's a long shot, which means that Linux may never have the same experience as DTrace on Solaris. But this is an area where you can help: ask your distro maintainer to include bpftrace (plus bcc and sysstat) by default. These are crisis tools, often used to analyze a system suffering an urgent performance issue, and the time to install them ("apt-get update; apt-get install ...") can mean the issue disappears before you've had a chance to see it.
What about DTrace?
Just because Linux got eBPF, doesn't make DTrace a terrible tool overnight. It will still be useful on OSes that have it, and any that does is well positioned for a future upgrade to eBPF, which can reuse internals like provider instrumentation. Work has already began to bring eBPF to BSD, where BPF originated.
It may be worth reassuring people who have invested time into learning DTrace that I don't think that time is wasted. The hardest part of using DTrace or bpftrace is knowing what to do with it, following a methodology to approach problems. Once you get into the guts of some complex software for a pressing production issue, whether you type quantize() or hist() is really the least of your problems. Any time you've spent debugging problems with DTrace is going to help with bpftrace as well.
What about ply?
ply, by Tobais Waldekranz, is another front-end to BPF. I like it. It isn't complete yet, but has some interesting differences to bpftrace: ply emits instructions directly, whereas bpftrace uses llvm's IR API (which can be fairly difficult to code in). ply is also C, whereas bpftrace is C++.
# ply -A -c 'kprobe:SyS_read { @start[tid()] = nsecs(); }
    kretprobe:SyS_read /@start[tid()]/ { @ns.quantize(nsecs() - @start[tid()]);
        @start[tid()] = nil; }'
2 probes active
^Cde-activating probes
[...]
@ns:

    [ 512,   1k)           3 |########                        |
    [  1k,   2k)           7 |###################             |
    [  2k,   4k)          12 |################################|
    [  4k,   8k)           3 |########                        |
    [  8k,  16k)           2 |#####                           |
    [ 16k,  32k)           0 |                                |
    [ 32k,  64k)           0 |                                |
    [ 64k, 128k)           3 |########                        |
    [128k, 256k)           1 |###                             |
    [256k, 512k)           1 |###                             |
    [512k,   1M)           2 |#####                           |
[...]
It's possible that ply will find its users on embedded Linux and minimal environments, whereas bpftrace will be popular for large server Linux. Note that Tobais currently has been developing many new ply features (a ply 2.0) in his own ply repo, that isn't reflected in the iovisor repo yet.
Acknowledgements
bpftrace was created by Alastair Robertson, and builds upon eBPF and bcc that has had many contributors. See the Acknowledgemets section in my DTrace for Linux 2016 post which lists DTrace and earlier tracing work. In particular, if you're using bpftrace, you're also using a lot of code developed by Alexei Starovoitov (eBPF), Brendan Blanco (libbpf), myself, Sasha Goldshtein (USDT), and others. See the bcc repo for the library components we're using. Facebook also have many engineers working on BPF and bcc, who have made it the mature technology it is today.
bpftrace itself has a language similar to DTrace, as well as awk and C. This wasn't the first attempt at a high-level language on eBPF: the first was Shark, by Jovi Zangwei, then ply by Tobais Waldekranz, then bpftrace by Alastair Robertson. At some point Richard Henderson was developing eBPF as a backend for SystemTap. Thanks to everyone who worked on these, and all the other technologies that we use.
Finally, thanks to Netflix, who provide a great supportive environment for me to work on and contribute to different technologies, including BPF.
Conclusion
eBPF changed the landscape of Linux tracing since it began merging into the kernel four years ago. We now have libraries, tools, and a high-level front-end built from scratch for eBPF that is nearing completion: bpftrace. bpftrace gives you the power to analyze the system in custom detail, and find performance wins that other tools cannot. It is complementary to bcc: bcc is great for complex tools, and bpftrace is great for ad hoc one-liners. In this post I described bpftrace and how it compares to DTrace. In my next post, I'll focus more on bpftrace.
More reading:
- bpftrace on github
- one-liners tutorial
- reference guide
- bcc on github
Alastair's first talk on bpftrace is at the Tracing Summit in Edinburgh, Oct 25th.
To get started with bpftrace, you need a newer Linux kernel version (4.9 or newer is better), and follow the INSTALL.md in the repo, eg: Ubuntu bpftrace install instructions, which will improve once we have packages. (If you work at Netflix, there's a nflx-bpftrace package for the Bionic BaseAMI, which will become a default install.) What cool thing will you build with bpftrace?
Click here for Disqus comments (ad supported).