

A tracer is an advanced performance analysis and troubleshooting tool, but don't let that intimidate you... If you've used strace(1) or tcpdump(8) – you've used a tracer. System tracers can see much more than just syscalls or packets, as they can typically trace any kernel or application software.
There are so many Linux tracers that the choice is overwhelming. As each has an official (or unofficial) pony-corn mascot, we have enough for a kids' show.
Which tracer should you use?
I've answered this question for two audiences: for most people, and, for performance/kernel engineers. This will also change over time, so I'll need to post follow-ups, maybe once a year or so.
For Most People
Most people (developers, sysadmins, devops, SREs, ...) are not going to learn a system tracer in gory detail. Here's what you most likely need to know and do about tracers:
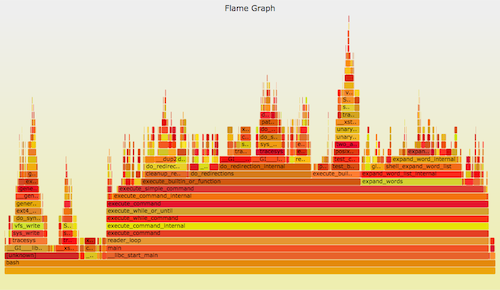
1. Use perf_events for CPU profiling
Use perf_events to do CPU profiling. The profile can be visualized as a flame graph. Eg:
git clone --depth 1 https://github.com/brendangregg/FlameGraph
perf record -F 99 -a -g -- sleep 30
perf script | ./FlameGraph/stackcollapse-perf.pl | ./FlameGraph/flamegraph.pl > perf.svg
Linux perf_events (aka "perf", after its command) is the official tracer/profiler for Linux users. It is in the kernel source, and is well maintained (and currently rapidly being enhanced). It's usually added via a linux-tools-common package.
perf can do many things, but if I had to recommend you learn just one, it would be CPU profiling. Even though this is not technically "tracing" of events, as it's sampling. The hardest part is getting full stacks and symbols to work, which I covered in my Linux Profiling at Netflix talk for Java and Node.js.
2. Know what else is possible
As a friend once said: "You don't need to know how to operate an X-ray machine, but you do need to know that if you swallow a penny, an X-ray is an option!" You need to know what is possible with tracers, so that if your business really needs it, you can either learn how to do it later, or hire someone who does.
In a nutshell: performance of virtually anything can be understood with tracing. File system internals, TCP/IP processing, device drivers, application internals. Read my lwn.net article on ftrace, and browse my perf_events page, as examples of some tracing (and profiling) capabilities.
3. Ask for front ends
If you are paying for performance analysis tools (and there are many companies that sell them), ask for Linux tracing support. Imagine an intuitive point-and-click interface that can expose kernel internals, including latency heatmaps at different stack locations. I described such an interface in my Monitorama talk.
I've created and open sourced some front ends myself, although for the CLI (not GUIs). These also allow people to benefit from the tracers more quickly and easily. Eg, from my perf-tools, tracing new processes:
# ./execsnoop
Tracing exec()s. Ctrl-C to end.
   PID   PPID ARGS
 22898  22004 man ls
 22905  22898 preconv -e UTF-8
 22908  22898 pager -s
 22907  22898 nroff -mandoc -rLL=164n -rLT=164n -Tutf8
[...]
At Netflix, we're creating Vector, an instance analysis tool that should also eventually front Linux tracers.
For Performance or Kernel Engineers
Our job is much harder, since most people may be asking us to figure out how to trace something, and therefore which tracer to use. To properly understand a tracer, you usually need to spend at least one hundred hours with it. Understanding all the Linux tracers to make a rational decision between them a huge undertaking. (I may be the only person who has come close to doing this.)
Here's what I'd recommend. Either:
A) Pick one all-powerful tracer, and standardize on that. This will involve a lot of time figuring out its nuances and safety in a test environment. I'd currently recommend the latest version of SystemTap (ie, build from source). I know of companies that have picked LTTng, and are happy with it, although it's not quite as powerful (although, it is safer). If sysdig adds tracepoints or kprobes, it could be another candidate.
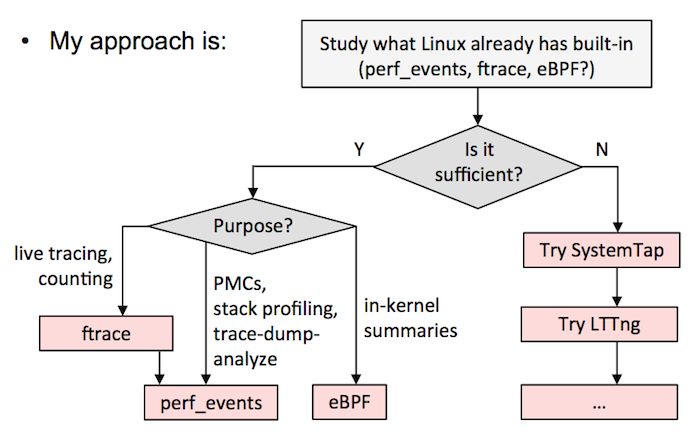
B) Follow the above flow chart from my Velocity tutorial. It will mean using ftrace or perf_events as much as possible, eBPF as it gets integrated, and then other tracers like SystemTap/LTTng to fill in the gaps. This is what I do in my current job at Netflix.
Comments by tracer:
1. ftrace
I love Ftrace, it's a kernel hacker's best friend. It's built into the kernel, and can consume tracepoints, kprobes, and uprobes, and provides a few capabilities: event tracing, with optional filters and arguments; event counting and timing, summarized in-kernel; and function-flow walking. See ftrace.txt from the kernel source for examples. It's controlled via /sys, and is intended for a single root user (although you could hack multi-user support using buffer instances). Its interface can be fiddly at times, but it's quite hackable, and there are front ends: Steven Rostedt, the main ftrace author, has created trace-cmd, and I've created the perf-tools collection. My biggest gripe is that it isn't programmable, so you can't, for example, save and fetch timestamps, calculate latency, and then store it as a histogram. You'll need to dump events to user-level, and post-process, at some cost. It may become programmable via eBPF.
2. perf_events
perf_events is the main tracing tool for Linux users, its source is in the Linux kernel, and is usually added via a linux-tools-common package. Aka "perf", after its front end, which is typically used to trace & dump to a file (perf.data), which it does relatively efficiently (dynamic buffering), and then post-processeses that later. It can do most of what ftrace can. It can't do function-flow walking, and is a bit less hackable (as it has better safety/error checking). But it can do profiling (sampling), CPU performance counters, user-level stack translation, and can consume debuginfo for line tracing with local variables. It also supports multiple concurrent users. As with ftrace, it isn't kernel programmable yet, until perhaps eBPF support (patches have been proposed). If there's one tracer I'd recommend people learn, it'd be perf, as it can solve a ton of issues, and is relatively safe.
3. eBPF
The extended Berkeley Packet Filter is an in-kernel virtual machine that can run programs on events, efficiently (JIT). It's likely to eventually provide in-kernel programming for ftrace and perf_events, and to enhance other tracers. It's currently being developed by Alexei Starovoitov, and isn't fully integrated yet, but there's enough in-kernel (as of 4.1) for some impressive tools: eg, latency heat maps of block device I/O. For reference, see the BPF slides from Alexei, and his eBPF samples.
4. SystemTap
SystemTap is the most powerful tracer. It can do everything: profiling, tracepoints, kprobes, uprobes (which came from SystemTap), USDT, in-kernel programming, etc. It compiles programs into kernel modules and loads them – an approach which is tricky to get safe. It is also developed out of tree, and has had issues in the past (panics or freezes). Many are not SystemTap's fault – it's often the first to use certain tracing capabilities with the kernel, and the first to run into bugs. The latest version of SystemTap is much better (you must compile from source), but many people are still spooked from earlier versions. If you want to use it, spend time in a test environment, and chat to the developers in #systemtap on irc.freenode.net. (Netflix has a fault-tolerant architecture, and we have used SystemTap, but we may be less concerned about safety than you.) My biggest gripe is that it seems to assume you'll have kernel debuginfo, which I don't usually have. It actually can do a lot without it, but documentation and examples are lacking (I've begun to help with that myself).
5. LTTng
LTTng has optimized event collection, which outperforms other tracers, and also supports numerous event types, including USDT. It is developed out of tree. The core of it is very simple: write events to a tracing buffer, via a small and fixed set of instructions. This helps make it safe and fast. The downside is that there's no easy way to do in-kernel programming. I keep hearing that this is not a big problem, since it's so optimized that it can scale sufficiently despite needing post processing. It also has been pioneering a different analysis technique, more of a black box recording of all interesting events that can be studied in GUIs later. I'm concerned about such a recording missing events I didn't have the foresight to record, but I really need to spend more time with it to see how well it works in practice. It's the tracer I've spent the least time with (no particular reason).
6. ktap
ktap was a really promising tracer, which used an in-kernel lua virtual machine for processing, and worked fine without debuginfo and on embedded devices. It made it into staging, and for a moment looked like it would win the trace race on Linux. Then eBPF began kernel integration, and ktap integration was postponed until it could use eBPF instead of its own VM. Since eBPF is still integrating many months later, the ktap developers have been waiting a long time. I hope it restarts development later this year.
7. dtrace4linux
dtrace4linux is mostly one man's part-time effort (Paul Fox) to port Sun DTrace to Linux. It's impressive, and some providers work, but it's some ways from complete, and is more of an experimental tool (unsafe). I think concern over licensing has left people wary of contributing: it will likely never make it into the Linux kernel, as Sun released DTrace under the CDDL license; Paul's approach to this is to make it an add-on. I'd love to see DTrace on Linux and this project finished, and thought I'd spend time helping it finish when I joined Netflix. However, I've been spending time using the built-in tracers, ftrace and perf_events, instead.
8. OL DTrace
Oracle Linux DTrace is a serious effort to bring DTrace to Linux, specifically Oracle Linux. Various releases over the years have shown steady progress. The developers have even spoken about improving the DTrace test suite, which shows a promising attitude to the project. Many useful providers have already been completed: syscall, profile, sdt, proc, sched, and USDT. I'm still waiting for fbt (function boundary tracing, for kernel dynamic tracing), which will be awesome on the Linux kernel. Its ultimate success will hinge on whether it's enough to tempt people to run Oracle Linux (and pay for support). Another catch is that it may not be entirely open source: the kernel components are, but I've yet to see the user-level code.
9. sysdig
sysdig is a new tracer that can operate on syscall events with tcpdump-like syntax, and lua post processing. It's impressive, and it's great to see innovation in the system tracing space. Its limitations are that it is syscalls only at the moment, and, that it dumps all events to user-level for post processing. You can do a lot with syscalls, although I'd like to see it support tracepoints, kprobes, and uprobes. I'd also like to see it support eBPF, for in-kernel summaries. The sysdig developers are currently adding container support. Watch this space.
Further Reading
My own work with the tracers includes:
ftrace: My perf-tools collection (see the examples directory); my lwn.net article on ftrace; a LISA14 talk; and the posts: function counting, iosnoop, opensnoop, execsnoop, TCP retransmits, uprobes, and USDT.
perf_events: My perf_events Examples page; a Linux Profiling at Netflix talk for SCALE; and the posts CPU Sampling, Static Tracepoints, Heat Maps, Counting, Kernel Line Tracing, off-CPU Time Flame Graphs.
eBPF: The post eBPF: One Small Step, and some BPF-tools (I need to publish more).
SystemTap: I wrote a Using SystemTap post a long time ago, which is somewhat out of date. More recently I published some systemtap-lwtools, showing how SystemTap can be used without kernel debuginfo.
LTTng: I've used it a little, but not enough yet to publish anything.
ktap: My ktap Examples page includes one-liners and scripts, although these were for an earlier version.
dtrace4linux: I included some examples in my Systems Performance book, and I've developed some small fixes for things in the past, eg, timestamps.
OL DTrace: As this is a straight port of DTrace, much of my earlier DTrace work should be relevant (too many links to list here; search on my homepage). I may develop some specific tools once this is more complete.
sysdig: I contributed the fileslower and subsecond offset spectrogram chisels.
others: I did write a warning post about strace.
Please, no more tracers! ... If you're wondering why Linux doesn't just have one, or DTrace itself, I answered these in my From DTrace to Linux talk, starting on slide 28.
Thanks to Deirdré Straughan for edits, and for creating the tracing ponies (with General Zoi's pony creator).
Click here for Disqus comments (ad supported).