

The recently revealed Meltdown and Spectre bugs are not just extraordinary issues of security, but also performance. The patches that workaround Meltdown introduce the largest kernel performance regressions I've ever seen. Many thanks to the engineers working hard to develop workarounds to these processor bugs.
In this post I'll look at the Linux kernel page table isolation (KPTI) patches that workaround Meltdown: what overheads to expect, and ways to tune them. Much of my testing was on Linux 4.14.11 and 4.14.12 a month ago, before we deployed in production. Some older kernels have the KAISER patches for Meltdown, and so far the performance overheads look similar. These results aren't final, since more changes are still being developed, such as for Spectre.
Note that there are potentially four layers of overhead for Meltdown/Spectre, this is just one. They are:
- Guest kernel KPTI patches (this post)
- Intel microcode updates
- Cloud provider hypervisor changes (for cloud guests)
- Retpoline compiler changes
KPTI Factors
To understand the KPTI overhead, there are at least five factors at play. In summary:
- Syscall rate: there are overheads relative to the syscall rate, although high rates are needed for this to be noticable. At 50k syscalls/sec per CPU the overhead may be 2%, and climbs as the syscall rate increases. At my employer (Netflix), high rates are unusual in cloud, with some exceptions (databases).
- Context switches: these add overheads similar to the syscall rate, and I think the context switch rate can simply be added to the syscall rate for the following estimations.
- Page fault rate: adds a little more overhead as well, for high rates.
- Working set size (hot data): more than 10 Mbytes will cost additional overhead due to TLB flushing. This can turn a 1% overhead (syscall cycles alone) into a 7% overhead. This overhead can be reduced by A) pcid, fully available in Linux 4.14, and B) Huge pages.
- Cache access pattern: the overheads are exacerbated by certain access patterns that switch from caching well to caching a little less well. Worst case, this can add an additional 10% overhead, taking (say) the 7% overhead to 17%.
To explore these I wrote a simple microbenchmark where I could vary the syscall rate and the working set size (source). I then analyzed performance during the benchmark (active benchmarking), and used other benchmarks to confirm findings. In more detail:
1. Syscall rate
This is the cost of extra CPU cycles in the syscall path. Plotting the percent performance loss vs syscall rate per CPU, for my microbenchmark:
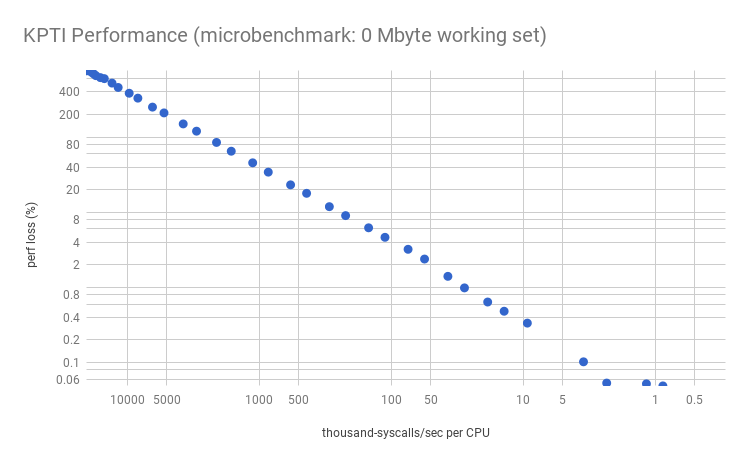
Applications that have high syscall rates include proxies, databases, and others that do lots of tiny I/O. Also microbenchmarks, which often stress-test the system, will suffer the largest losses. Many services at Netflix are below 10k syscalls/sec per CPU, so this type of overhead is expected to be negligible for us (<0.5%).
If you don't know your syscall rate, you can measure it, eg, using perf:
sudo perf stat -e raw_syscalls:sys_enter -a -I 1000
This shows the system-wide syscall rate. Divide it by the CPU count (as reported by mpstat, etc) for the per-CPU rate. Then by 1000 for the graph above. Note that this perf stat command causes some overhead itself, which may be noticeable for high syscall rates (>100k/sec/CPU). You can switch to ftrace/mcount to measure it with lower overhead if that is desired. For example, using my perf-tools:
sudo ./perf-tools/bin/funccount -i 1 -d 10 '[sS]y[sS]_*'
Then summing the syscall column.
I could have taken one measurement and extrapolated most of the above graph based on a model, but it's good to double check that there's no hidden surprises. The graph is mostly as expected, expect the lower right which shows variance and missing data points: these missing points are due to slightly negative values that are elided by the logarithmic scale. It would be easy to dismiss this all as a 0.2% error margin, magnified by the logarithmic scale, but I think much of it is part of the profile which changes at this syscall rate (between 5k and 10k syscalls/sec/CPU). This will be more obvious in the next sections, where I'll explore it further.
My microbenchmark calls a fast syscall in a loop, along with a user-level loop to simulate an application working set size. By gradually increasing the time in the user-level loop from zero, the syscall rate decreases as more cycles are consumed in a CPU-bound user-mode thread. This gives us a spectrum from a high syscall rate of >1M/sec, down to a low syscall rate and mostly user time (>99%). I then measured this syscall range with and without the KPTI patches (by setting nopti, and also running older and newer kernels to double check).
I collected CPU profile as a CPU flame graph for both systems, but, for a change, they was boring: extra cycles were just in the syscall code, as one would expect reading the KPTI changes. To understand the overhead further I'll need to use instruction-level profiling, such as by using perf annotate, and PMC (Performance Monitoring Counter) analysis of the CPU cycles (more on this later).
2. Context Switch & Page Fault Rate
These are tracked by the kernel and easily read via /proc or sar(1):
# sar -wB 1
Linux 4.14.12-virtual (bgregg-c5.9xl-i-xxx)       02/09/2018      _x86_64_     (36 CPU)

05:24:51 PM    proc/s   cswch/s
05:24:52 PM      0.00 146405.00

05:24:51 PM  pgpgin/s pgpgout/s   fault/s  majflt/s  pgfree/s pgscank/s pgscand/s pgsteal/s %vmeff
05:24:52 PM      0.00      0.00      2.00      0.00     50.00      0.00      0.00      0.00   0.00
[...]
As with syscalls, the higher these rates are, the higher the overheads. I'd add the context switch rate (cswch/s) to the syscall rate for the estimation graphs on this page (normalized per-CPU).
3. Working Set Size (hot data)
Now my microbenchmark simulates a working set size (WSS) – an area of frequently accessed memory – by reading 100 Mbytes of data in a loop and striding by the cacheline size. Performance gets much worse for lower syscall rates:
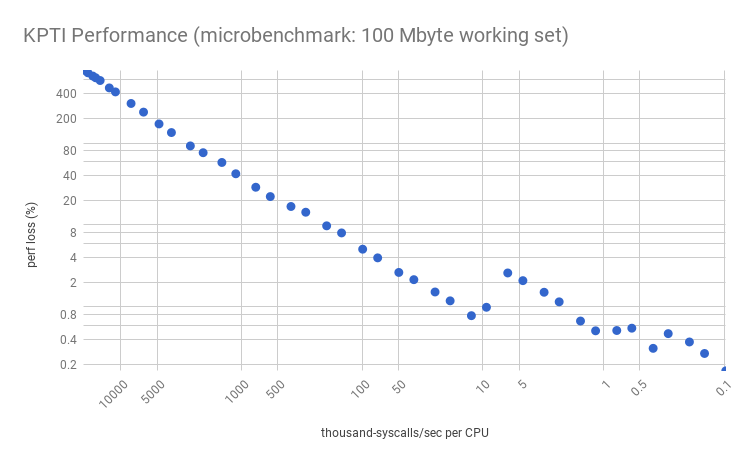
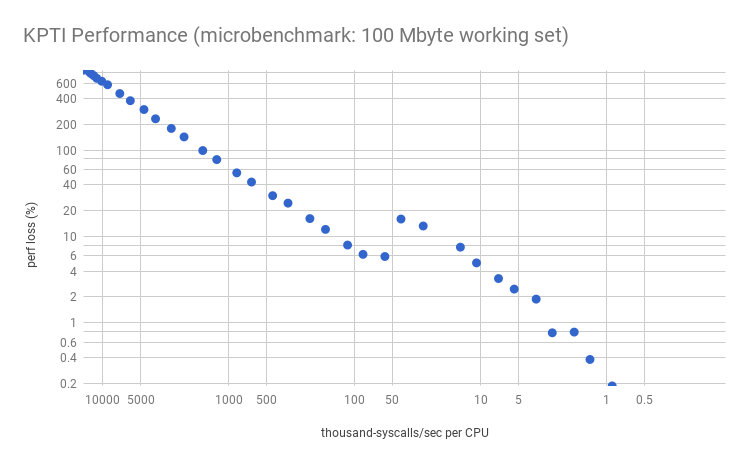
Note the overhead "jump" between 10k and 5k syscalls/sec/CPU? The characteristics of this jump is dependent on the instance type, processor, and workload, and can appear at different points with different magnitudes: this is showing a c5.9xl with a 1.8% jump, but on a m4.2xl the jump is around 50k syscalls/sec/CPU and is much larger: 10% (shown here). I’ll analyze this in the next section. Here, we just want to look at the overall trend: much worse performance given a working set.
Will your overhead look like this graph, or the earlier one, or worse? That depends on your working set size: this graph is for 100 Mbytes, and the earlier was zero. See my previous post on working set size estimation and the full website. My guess is that 100 Mbytes is a large-ish case of memory needed syscall-to-syscall.
Linux 4.14 introduced full pcid support, which improves performance provided the processor also has pcid (looks like it's common in EC2). Gil Tene wrote a post explaining why PCID is now a critical performance/security feature on x86.
Update: Earlier versions of Linux had some pcid support (as pointed out by a comment on this post), and/or I've heard vendors like Canonical have backported pcid patches. I've since tested the 4.4.115 kernel and confirmed that pcid is used there. In detail, booting with "nopcid" for a given workload had 8.4% DTLB and 4.4% ITLB miss walk handling, and then booting default (with pcid) had 0.0% DTLB and 1.1% ITLB. So yes, pcid is working on 4.4 (on 4.4.115, at least).
It's also possible to use huge pages to improve performance further (either transparent huge pages, THP, which is easy to setup but has had problems in older versions with compaction; or explicit huge pages, which should perform better). The following graph summarizes the options:
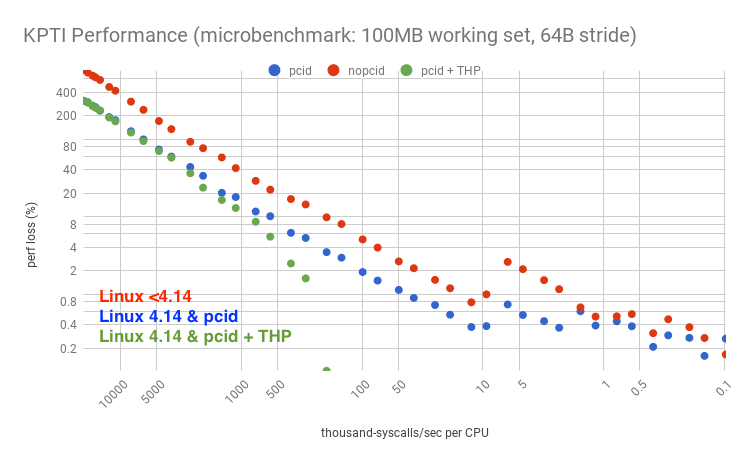
For this microbenchmark, huge pages improved performance so much – despite KPTI – that it turned the performance loss into a performance gain. The logarithmic axis has elided the negative points, but here they are on a linear axis, zoomed:
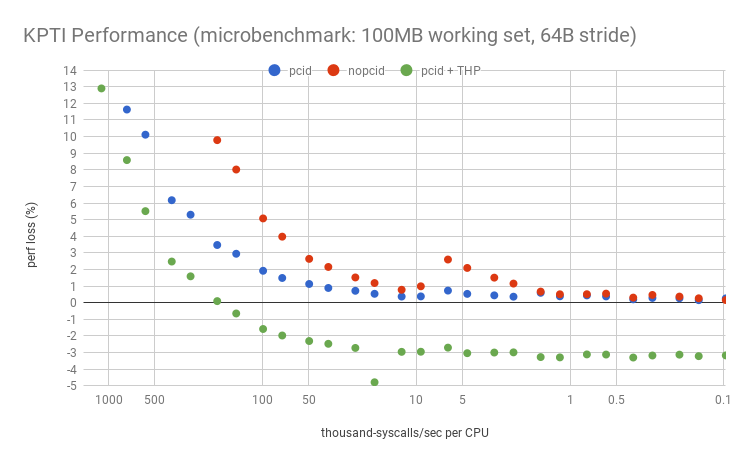
Let's say your server was doing 5k syscalls/sec/CPU, and you suspect you have a large working set, similar to this 100 Mbyte test. On recent LTS Linux (4.4 or 4.9) with KPTI (or KAISER) patches, the performance overhead would be about 2.1%. Linux 4.14 has pcid support, so that overhead becomes about 0.5%. With huge pages, the overhead becomes a gain of 3.0%.
A quick look at TLB PMCs explains much of this overhead: here I'm using tlbstat, a quick tool I hacked up in my pmc-cloud-tools repository. The following results look at a single point in the above graph (on a different system with full PMCs) where the worst case overhead from no KPTI to KPTI without pcid was 8.7%.
nopti:
# tlbstat -C0 1
K_CYCLES   K_INSTR      IPC DTLB_WALKS ITLB_WALKS K_DTLBCYC  K_ITLBCYC  DTLB% ITLB%
2835385    2525393     0.89 291125     4645       6458       187         0.23  0.01
2870816    2549020     0.89 269219     4922       5221       194         0.18  0.01
2835761    2524070     0.89 255815     4586       4993       157         0.18  0.01
[...]

pti, nopcid:
# tlbstat -C0 1
K_CYCLES   K_INSTR      IPC DTLB_WALKS ITLB_WALKS K_DTLBCYC  K_ITLBCYC  DTLB% ITLB%
2873801    2328845     0.81 6546554    4474231    83593      63481       2.91  2.21
2863330    2326694     0.81 6506978    4482513    83209      63480       2.91  2.22
2864374    2329642     0.81 6500716    4496114    83094      63577       2.90  2.22
[...]

pti, pcid:
# tlbstat -C0 1
K_CYCLES   K_INSTR      IPC DTLB_WALKS ITLB_WALKS K_DTLBCYC  K_ITLBCYC  DTLB% ITLB%
2862069    2488661     0.87 359117     432040     6241       9185        0.22  0.32
2855214    2468445     0.86 313171     428546     5820       9092        0.20  0.32
2869416    2488607     0.87 334598     434110     6011       9208        0.21  0.32
[...]

pti, pcid + thp:
# tlbstat -C0 1
K_CYCLES   K_INSTR      IPC DTLB_WALKS ITLB_WALKS K_DTLBCYC  K_ITLBCYC  DTLB% ITLB%
2863464    2594463     0.91 2601       298946     57         6215        0.00  0.22
2845726    2568730     0.90 3330       295951     42         6156        0.00  0.22
2872419    2597000     0.90 2746       298328     64         6211        0.00  0.22
[...]
The last two columns show cycles where a data TLB or instruction TLB walk was active in at least one PMH (page miss handler). The first two outputs show TLB details for the 8.7% performance loss, and the extra TLB walk cycles added up to 4.88% of all cycles. The remaining outputs show the introduction of PCID, and the addition of THP. PCID reduces both types of TLB walks, bringing the data walks similar to the pre-KPTI levels. Instruction walks are still elevated. The final output shows the difference huge pages make: data TLB walks are now zero. Instruction walks are still elevated, and I can see from /proc/PID/smaps that the instruction text is not using huge pages: I'll try to fix that with more tuning, which should improve performance even further.
Just to show how bad it gets: this is the first point on the graph where the overhead was over 800%, showing the non-KPTI vs KPTI without pcid systems:
nopti:
# tlbstat -C0 1
K_CYCLES   K_INSTR      IPC DTLB_WALKS ITLB_WALKS K_DTLBCYC  K_ITLBCYC  DTLB% ITLB%
2854768    2455917     0.86 565        2777       50         40          0.00  0.00
2884618    2478929     0.86 950        2756       6          38          0.00  0.00
2847354    2455187     0.86 396        297403     46         40          0.00  0.00
[...]

pti, nopcid:
# tlbstat -C0 1
K_CYCLES   K_INSTR      IPC DTLB_WALKS ITLB_WALKS K_DTLBCYC  K_ITLBCYC  DTLB% ITLB%
2875793    276051      0.10 89709496   65862302   787913     650834     27.40 22.63
2860557    273767      0.10 88829158   65213248   780301     644292     27.28 22.52
2885138    276533      0.10 89683045   65813992   787391     650494     27.29 22.55
2532843    243104      0.10 79055465   58023221   693910     573168     27.40 22.63
[...]
Half the CPU cycles have page walks active. I've never seen TLB pain this bad, ever. Just the IPC (instructions per cycle) alone tells you something bad is happening: dropping from 0.86 to 0.10, which is relative to the performance loss. I still recommend including IPC along with (not instead of) any %CPU measurement, so that you really know what the cycles are, as I discussed in CPU Utilization is Wrong.
4. Cache Access Pattern
Depending on the memory access pattern and working set size, an additional 1% to 10% overhead can occur at a certain syscall rate. This was seen as the jump in the earlier graph. Based on PMC analysis and the description of the changes, one suspected factor is additional page table memory demand on the KPTI system, causing the workload to fall out of a CPU cache sooner. Here are the relevant metrics:
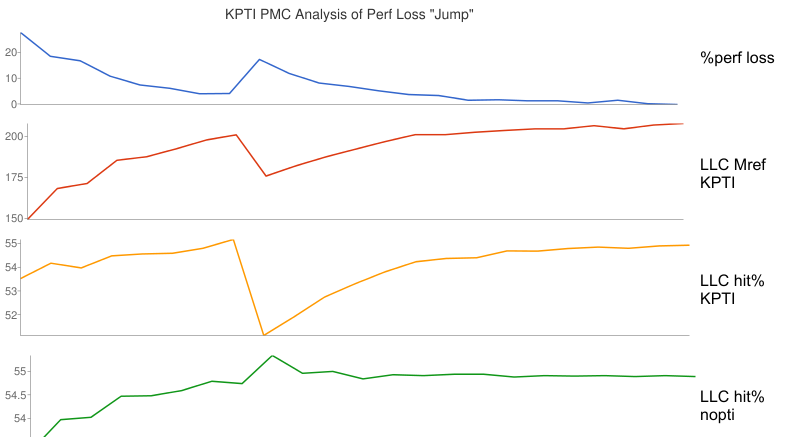
This shows that the performance loss jump corresponds to a similar drop in last-level cache (LLC) references (first two graphs): that is not actually interesting, as the lower reference rate is expected from a lower workload throughput. What is interesting is an abrupt drop in LLC hit ratio, from about 55% to 50%, which does not happen without the KPTI patches (the last nopti graph, which shows a small LLC hit ratio improvement). This is sounding like the extra KPTI page table references has pushed the working set out of a CPU cache, causing an abrupt drop in performance.
I don't think a 55% to 50% drop in LLC hit ratio can fully explain a 10% performance loss alone. Another factor is at play that would require additional PMCs to analyze, however, this target is an m4.16xl where PMCs are restricted to the architectural set. I described this in The PMCs of EC2: the architectural set is better than nothing, and a year ago we had nothing. Late last year, EC2 gained two more options for PMC analysis: the Nitro hypervisor, which provides all PMCs (more or less), and the bare metal instance type (currently in public preview). My earlier TLB analysis was on a c5.9xl, a Nitro hypervisor system. Unfortunately, the "jump" on that system is only about 1%, making it harder to spot outside the normal variance.
In short, there are some additional memory overheads with KPTI that can cause workloads to drop out of CPU cache a little sooner.
Sanity Tests
Putting these graphs to the test: a MySQL OLTP benchmark ran with 75k syscalls/sec/CPU (600k syscalls/sec across 8 CPUs), and is expected to have a large working set (so more closely resembles this 100Mb working set test, than the 0Mb one). The graph estimates the performance loss of KPTI (without huge pages or pcid) to be about 4%. The measured performance loss was 5%. On a 64-CPU system, with the same workload and same per-CPU syscall rate, the measured performance loss was 3%. Other tests were similarly close, as has been the production roll out.
The test that least matched the previous graphs was an application with a stress test driving 210k syscalls/sec/CPU + 27k context-switches/sec/CPU, and a small working set (~25 Mbytes). The estimated performance loss should have been less than 12%, but it was 25%. To check that there wasn't an additional overhead source, I analyzed this and saw that the 25% was due to TLB page walk cycles, which is the same overheads studied earlier. I'd guess the large discrepancy was because that application workload was more sensitive to TLB flushing than my simple microbenchmark.
Fixing Performance
1. Linux 4.14 & pcid
I mentioned this earlier, and showed the difference in the graph. It definitely works on 4.14, if you can run that, with CPUs that support pcid (check /proc/cpuinfo). It might work on some older kernels (like 4.4.115).
2. Huge Pages
I mentioned this earlier too. I won't summarize how to configure huge pages here with all their caveats, since that's a huge topic.
3. Syscall Reductions
If you were at the more painful end of the performance loss spectrum due to a high syscall rate, then an obvious move is to analyze what those syscalls are and look for ways to eliminate some. This used to be routine for systems performance analysis many years ago, but more recently the focus has been user-mode wins.
There are many ways to analyze syscalls. Here are several, ordered from most to least overhead:
- strace
- perf record
- perf trace
- sysdig
- perf stat
- bcc/eBPF
- ftrace/mcount
The fastest is ftrace/mcount, and I already had an example earlier from my perf-tools repo for counting syscalls. Summarizing 10 seconds:
# ./perf-tools/bin/funccount -d 10 '[sS]y[sS]_*'
Tracing "[sS]y[sS]_*" for 10 seconds...

FUNC                              COUNT
SyS_epoll_wait                        1
SyS_exit_group                        1
SyS_fcntl                             1
SyS_ftruncate                         1
[...]
SyS_newstat                          56
SyS_mremap                           62
SyS_rt_sigaction                     73
SyS_select                         1895
SyS_read                           1909
SyS_clock_gettime                  3791
SyS_rt_sigprocmask                 3856

Ending tracing...
Here's the same using my bcc/eBPF version of funccount and the syscall tracepoints, which was only possible since Linux 4.14 thanks to Yonghong Song's support for this:
# /usr/share/bcc/tools/funccount -d 10 't:syscalls:sys_enter*'
Tracing 310 functions for "t:syscalls:sys_enter*"... Hit Ctrl-C to end.

FUNC                                    COUNT
syscalls:sys_enter_nanosleep                1
syscalls:sys_enter_newfstat                 3
syscalls:sys_enter_mmap                     3
syscalls:sys_enter_inotify_add_watch        9
syscalls:sys_enter_poll                    11
syscalls:sys_enter_write                   61
syscalls:sys_enter_perf_event_open        111
syscalls:sys_enter_close                  152
syscalls:sys_enter_open                   157
syscalls:sys_enter_bpf                    310
syscalls:sys_enter_ioctl                  395
syscalls:sys_enter_select                2287
syscalls:sys_enter_read                  2445
syscalls:sys_enter_clock_gettime         4572
syscalls:sys_enter_rt_sigprocmask        4572
Detaching...
Now that you know the most frequent syscalls, look for ways to reduce them. You can use other tools to inspect their arguments and stack traces (eg: using perf record, or kprobe in perf-tools, trace in bcc, etc), and look for optimization opportunities. This is performance engineering 101.
Conclusion and Further Reading
The KPTI patches to mitigate Meltdown can incur massive overhead, anything from 1% to over 800%. Where you are on that spectrum depends on your syscall and page fault rates, due to the extra CPU cycle overheads, and your memory working set size, due to TLB flushing on syscalls and context switches. I described these in this post, and analyzed them for a microbenchmark. Of course, nothing beats testing with real workloads, and the analysis I've included here may be more useful in explaining why performance regressed and showing opportunities to tune it, than for the estimated regressions.
Practically, I'm expecting the cloud systems at my employer (Netflix) to experience between 0.1% and 6% overhead with KPTI due to our syscall rates, and I'm expecting we'll take that down to less than 2% with tuning: using 4.14 with pcid support, huge pages (which can also provide some gains), syscall reductions, and anything else we find.
This is only one out of four potential sources of overhead from Meltdown/Spectre: there's also cloud hypervisor changes, Intel microcode, and compilation changes. These KPTI numbers are also not final, as Linux is still being developed and improved.
Some related reading and references:
- Dave Hansen's kernel notes on the overhead: https://lkml.org/lkml/2018/1/4/775
- Linux initial KPTI patch code: https://git.kernel.org/pub/scm/linux/kernel/git/torvalds/linux.git/commit/?id=5aa90a84589282b87666f92b6c3c917c8080a9bf
- Meltdown and Spectre: https://spectreattack.com/
- Reading privileged memory with a side-channel: https://googleprojectzero.blogspot.com/2018/01/reading-privileged-memory-with-side.html
- Canonical's post on Meltdown and Spectre: https://insights.ubuntu.com/2018/01/24/meltdown-spectre-and-ubuntu-what-you-need-to-know/
- Red Hat's guide to performance impacts: https://access.redhat.com/articles/3307751
- Here’s how, and why, the Spectre and Meltdown patches will hurt performance: https://arstechnica.com/gadgets/2018/01/heres-how-and-why-the-spectre-and-meltdown-patches-will-hurt-performance/
- PostgreSQL performance testing: https://www.postgresql.org/message-id/20180102222354.qikjmf7dvnjgbkxe%40alap3.anarazel.de
- Meltdown Status by Greg Kroah-Hartman: http://kroah.com/log/blog/2018/01/06/meltdown-status/
- pcid support: https://kernelnewbies.org/Linux_4.14#Longer-lived_TLB_Entries_with_PCID
- PCID is now a critical performance/security feature on x86, by Gil Tene: http://archive.is/ma8Iw
- perf-tools: https://github.com/brendangregg/perf-tools
- perf: http://www.brendangregg.com/perf.html
- The PMCs of EC2: http://www.brendangregg.com/blog/2017-05-04/the-pmcs-of-ec2.html
- pmc-cloud-tools: https://github.com/brendangregg/pmc-cloud-tools
- CPU Utilization is Wrong: http://www.brendangregg.com/blog/2017-05-09/cpu-utilization-is-wrong.html
- WSS estimation: http://www.brendangregg.com/blog/2018-01-17/measure-working-set-size.html
Click here for Disqus comments (ad supported).