

(Update: I have a page on eBPF now: Linux eBPF Tools)
I've taken one small step with eBPF, but it heralds one giant leap for Linux tracing.
# ./bitehist
Tracing block device I/O... Interval 5 secs. Ctrl-C to end.

     kbytes          : count     distribution
       0 -> 1        : 3        |                                      |
       2 -> 3        : 0        |                                      |
       4 -> 7        : 3395     |************************************* |
       8 -> 15       : 1        |                                      |
      16 -> 31       : 2        |                                      |
      32 -> 63       : 738      |*******                               |
      64 -> 127      : 3        |                                      |
     128 -> 255      : 1        |                                      |
The output from my bitehist tool shows that most disk I/O was between 4 and 7 Kbytes in size, during the five seconds of tracing. There was also a smaller amount between 32 and 63 Kbytes.
This uses a custom, in-kernel histogram, implemented via an eBPF map.
Maps can provide many things, including the coveted latency histogram – a staple of Sun's DTrace utility. And, as with DTrace, maps are efficient. (eBPF maps may be even more so, as they are JIT-compiled.)
In this example, the map allows just the histogram data (the "count" column) to be passed from kernel to user-level. It's populated using a custom eBPF program, and uses dynamic tracing of kernel functions.
This is my first post about eBPF (extended Berkeley Packet Filter), and I'll summarize how we got here, why eBPF and maps are important, and where we're likely going to next.
Why We Need eBPF
Linux tracing has greatly improved in the past ten years. ftrace and perf_events are now part of the Linux kernel, which lets you analyze Linux performance in detail, and solve difficult processor-, kernel-, and application-level issues. Their capabilities have let me port some of my old DTrace tools to Linux. I've released these as the perf-tools collection, which I spoke about at LISA14 and wrote about in lwn.net.
But I've sometimes run into limitations, such as wanting low-overhead latency histograms. That capability, and much more, is made possible by eBPF, which began life by extending packet filtering capabilities. eBPF is now being integrated into the Linux kernel in stages. It's as if Linux is gaining superpowers, one at a time.
Here's how kernel developer Ingo Molnár described eBPF in an April 2015 lkml post:
One of the more interesting features in this cycle is the ability to attach eBPF programs (user-defined, sandboxed bytecode executed by the kernel) to kprobes. This allows user-defined instrumentation on a live kernel image that can never crash, hang or interfere with the kernel negatively.
This addition, to Linux 4.1, is a giant leap forward, as it allows new efficient kernel instrumentation to be created. eBPF will eventually attach to more than just kprobes, as well.

I'm excited about eBPF. I've tested it a number of times during the past year, and have discussed it with its developer, Alexei Starovoitov (PLUMgrid). I also summarized it at the Tracing Summit (2014), and introduced the unofficial eBPF mascot: the ponycorn on the right (created by Deirdré Straughan, who also created the DTrace ponycorn, and edited this post.)
eBPF has many features; a differentiator from other tracing tools is its maps.
eBPF Maps
eBPF maps are populated in-kernel by your custom eBPF program, and can be read from user-level code asynchronously. Maps have many uses, including:
- histograms: log, linear, or entirely custom.
- summary statistics: counts, average, min, max, etc.
- frequency counts: eg, event count by PID.
- latency: storing and retrieving timestamps by event, for measuring latency.
The histogram that my bitehist program prints is stored as an array. More complex data can be stored in a key-value hash. Eg, bitesize:
# ./bitesize 5 2
Tracing block device I/O... Interval 5 secs. Ctrl-C to end.

Thu May 14 23:03:17 2015

  PID: 583 UID: 0 CMD: cksum
     kbytes          : count     distribution
       4 -> 7        : 37       |                                      |
       8 -> 15       : 7        |                                      |
      16 -> 31       : 5        |                                      |
      32 -> 63       : 3        |                                      |
      64 -> 127      : 1        |                                      |
     128 -> 255      : 2152     |************************************* |

  PID: 582 UID: 0 CMD: dd
     kbytes          : count     distribution
       4 -> 7        : 70       |**                                    |
       8 -> 15       : 0        |                                      |
      16 -> 31       : 1        |                                      |
      32 -> 63       : 737      |************************************* |
[...]
This is storing a histogram by-PID. It shows that the cksum command was using 128 to 255 Kbyte disk I/O.
Show Me The Code!
I've previously described eBPF's ease of use as brutal, and by comparison with other tracers, it still is. My original DTrace version of bitesize is about a dozen lines of code, but it could easily be a one-liner. My eBPF version, written in C, is currently over 200 lines of code.
The good news is that it's going to get easier, which I'll discuss in a moment. But, if you are curious about what the code currently looks like, the source for both my programs is on github: bitehist and bitesize. These are based on Alexei's eBPF samples, which are worth checking out. Below are some snippets from bitehist.
The following declares a map of type array (BPF_MAP_TYPE_ARRAY), and specifies the size of the key, value, and number of elements. This stores the histogram (from bitehist_kern.c):
struct bpf_map_def SEC("maps") hist_map = {
        .type = BPF_MAP_TYPE_ARRAY,
        .key_size = sizeof(u32),
        .value_size = sizeof(long),
        .max_entries = 64,
};
The following populates the map. Yes, the kprobe interface is unstable. This should use tracepoints instead, when they are supported by eBPF (from bitehist_kern.c):
/* kprobe is NOT a stable ABI
 * kernel functions can be removed, renamed or completely change semantics.
 * Number of arguments and their positions can change, etc.
 * In such case this bpf+kprobe example will no longer be meaningful.
 */
SEC("kprobe/blk_start_request")
int bpf_prog1(struct pt_regs *ctx)
{
        long rq = ctx->di;
        struct request *req = (struct request *)ctx->di;
        long *value;
        u32 index = log2l(_(req->__data_len) / 1024);

        value = bpf_map_lookup_elem(&hist_map, &index);
        if (value)
                __sync_fetch_and_add(value, 1);
And this fetches the map data from user-level (from bitehist_user.c):
static void print_log2_hist(int fd, const char *type)
[...]
        for (key = 0; key < MAX_INDEX; key++) {
                bpf_lookup_elem(fd, &key, &value);
                data[key] = value;
The bitesize program uses a hash instead of an array (BPF_MAP_TYPE_HASH), where the key is a C struct containing both the process credentials and the kbyte index, and the value was the count.
Future
In the natural course of writing these programs, Alexei and I have created some common functions and program templates that can be re-used, e.g., to print histograms, calculate log2, clear maps, etc. This means that programming eBPF C will be downhill from here.
However, its difficulty should not be a major problem for adoption. As I found with DTrace, many people just wanted to use my programs – not write them themselves. The same should also be true of eBPF. So long as Alexei, I, and others write and publish useful programs, eBPF should be used successfully.
That said, there could be an eBPF front-end (or multiple front-ends), to provide a higher-level language for ease of use. This is something the ktap developer Jovi Zhangwei has been considering. Developers at Huawei have also been working on a bpf subcommand to perf. Another system monitoring project, shark, already claims eBPF support (although I haven't tried it yet).
I'd expect the inclusion of eBPF in the kernel to trigger support in all tracers. We should also see new uses, both for observability and functionality, come out of eBPF.
BTW, we also know that "eBPF" is not an illustrative name. Have a better idea? (evil) Black Pony Flying, to match "eBPF" and the mascot, has been suggested! (But he’s not really evil – just wicked.)
More Examples
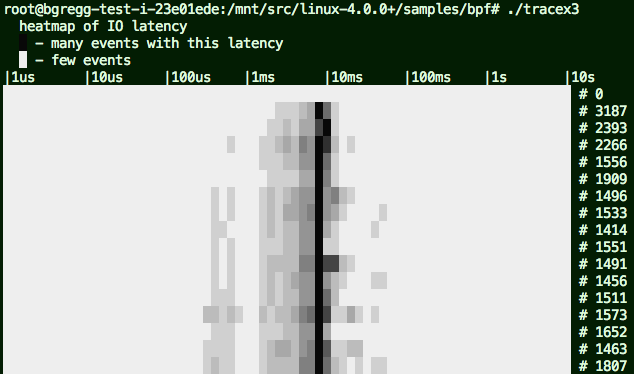
Alexei's eBPF samples includes tracex3 for showing disk I/O latency as a heat map:
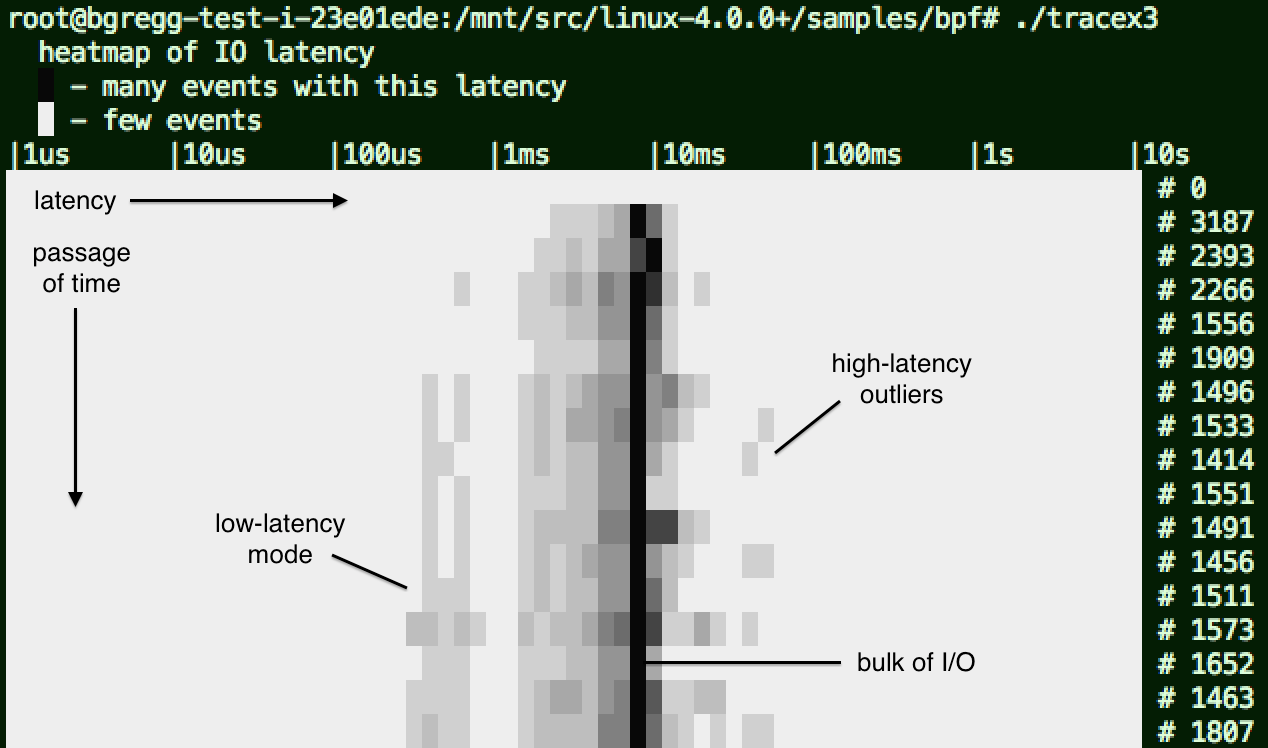
The passage of time is on the y-axis (going downwards), and latency is on the x-axis. The color depth shows how many I/O fell into a time and latency range: darker for more. This particular example shows that most I/O took around 9 ms, but with a wide distribution. I've noted some other features on the image (original).
Latency heat maps show not only the distribution of latency, including multiple modes and outliers, but also changes over time. See my latency heatmaps page for an introduction (its x and y axes are flipped).
The tracex3 program uses one map to store timestamps when disk I/O is issued, and another map to storing latencies as a histogram, which is read each second from the user-level program.
Conclusion
eBPF (enhanced BPF) is being integrated into the Linux kernel, and allows new observability tools to be created, as well as other uses. In particular, it allows the creation of low-overhead latency histograms and heatmaps, for detailed performance analysis.
My bitehist program may be one small step with eBPF, but its use of custom in-kernel maps is a huge leap for Linux tracing.
More Reading
- https://lwn.net/Articles/437981/ A JIT for packet filters, Apr 12, 2011
- https://lwn.net/Articles/575444/ tracing filters with BPF, Dec 2, 2013
- https://lwn.net/Articles/575531/ BPF tracing filters, Dec 4, 2013
- https://lkml.org/lkml/2014/2/5/772 [RFC PATCH v2 tip 0/7] 64-bit BPF insn set and tracing filters, 5 Feb 2014
- https://lkml.org/lkml/2014/2/5/740 [RFC PATCH v2 tip 7/7] tracing filter examples in BPF, 5 Feb 2014
- https://lkml.org/lkml/2014/6/27/545 [PATCH RFC net-next 00/14] BPF syscall, maps, verifier, samples, 27 Jun 2014
- http://lwn.net/Articles/612878/ The BPF system call API, version 14, 24 Sep 2014
- https://github.com/torvalds/linux/tree/master/samples/bpf eBPF samples
Also check on this blog; note that future posts may drop the "e" and describe these as just "BPF" enhancements, as they often are described on lkml.
Click here for Disqus comments (ad supported).