

DTrace Tools
The following are open source tools and examples that use DTrace, an implementation of dynamic tracing that is available in different OSes (Solaris, Mac OS X, FreeBSD, ...). DTrace helps troubleshoot problems on servers by providing new detailed views of application and system internals, to a level that was previously difficult or impossible to access. It provides a language to write DTrace scripts that is similar to C and awk and is event based. For a longer summary, see the wikipedia DTrace entry.
This website contains many of my first DTrace scripts, written during 2004-5 on pre-release Solaris 10. These were developed into a collection called the DTraceToolkit, which contains newer versions of the scripts found here. My most recent collection was published in the DTrace book (Prentice Hall, 2011) pictured on the right, which contains many new scripts. Those new scripts can be found on the www.dtracebook.com website.
On this page: Linux, Guide, DTraceToolkit, DTrace One-Liners, Scripts, Examples, DTraceTazTool, DExplorer, Links.
Operating Systems
DTrace is available for Mac OS X, FreeBSD, and the Solaris family of operating systems: Solaris 10, Oracle Solaris 11, SmartOS, OmniOS, and anything else based on the illumos kernel.
Many of the DTrace scripts on this page were originally written for Solaris 10. Some will work on other operating systems with out changes, some will require minor tweaks to get running.
Linux
As of Linux 4.9, the Linux kernel finally has similar raw capabilities as DTrace. This is the culmination of many tracing projects and technologies that were merged in the Linux kernel over the years, including: profiling and PMC events (perf_events), kernel static tracing (tracepoints), kernel dynamic tracing (kprobes), and user dynamic tracing (uprobes). The prior Linux tracers were ftrace and perf_events. The new Linux tracer, which builds upon all of these, is enhanced BPF with multiple front-ends available: in particular, bcc and bpftrace. See my posts about it: DTrace for Linux 2016 (eBPF) and DTrace for Linux 2018 (bpftrace). I also have a page on Linux eBPF Tracing.
If you want a DTraceToolkit-like experience (canned tools), check out bcc. If you want a DTrace-like experience (D programming), check out bpftrace. I've published tools for both.
For Linux tracing prior to eBPF, I wrote a collection of ftrace and perf_events tools, similar to the DTraceToolkit, that run on older Linux kernels: perf-tools, which I also talked about at LISA, Linux Performance Analysis: New Tools and Old Secrets.
What about the add ons, like SystemTap, ktap, etc? Now that eBPF has been included in 4.9, all add ons should be looking at using eBPF for back end capabilities. That started in 2017 and will continue in 2019, as 4.9 kernels are rolled out and there's more demand for eBPF tools. To see some older material on these add on tracers, I did have a ktap page, and gave a talk in 2014, From DTrace To Linux. As for DTrace itself, there are two projects to port it to Linux: the dtrace4linux project, and, a different port for Oracle Linux. These ports do not appear to have momentum, whereas bcc/eBPF does.
Guide
How does one get started with DTrace? You can use DTrace by just running scripts, or, you can write them yourself.
Using DTrace scripts
Not everyone has the time to sit down and write a DTrace script from scratch, or the time to learn how. Not to worry, there are many scripts online to download and use. You can:
- Download the DTraceToolkit
- Check out the DTrace OneLiners.
- See the DTrace scripts and one-liners in the DTrace book.
- Use scripts found in /usr/demo/dtrace, or in the DTrace Guide.
- Download Scripts from this website or Other websites.
- Search the DTrace mailing list for useful scripts, or elsewhere on the Internet.
Writing DTrace scripts
Some people will write their own customised DTrace scripts to troubleshoot faults or solve performance issues.
- It helps to know C
- It helps to know a little about the kernel
- The sky's the limit
To get started writing your own scripts:
- Read Chapter 1 (at least) of the DTrace Guide.
- Check out the DTrace OneLiners.
- Read through the DTrace Examples.
- Study scripts. The best order would be kill.d, bitesize.d, sshkeysnoop.d, shellsnoop.d.
- See Other websites for scripts.
- Download the DTraceToolkit
- Read the DTrace book.
- Participate in the DTrace mailing list.
Note: Many of the DTrace scripts on this site have been wrapped in the Bourne shell or Perl to provide command line options, allowing tools to be created for system administrators that are intuitive and easy to learn, by following the existing conventions and style of other Unix tools.
DTraceToolkit
See the DTraceToolkit website (and please update links to point to it).
DTrace One Liners
These are handy one liners to use at the command line. dtrace_oneliners.txt contains the full listing with examples.
# New processes with arguments:
dtrace -n 'proc:::exec-success { trace(curpsinfo->pr_psargs); }'

# Files opened by process:
dtrace -n 'syscall::open*:entry { printf("%s %s",execname,copyinstr(arg0)); }'

# Syscall count by program:
dtrace -n 'syscall:::entry { @num[execname] = count(); }'

# Syscall count by syscall:
dtrace -n 'syscall:::entry { @num[probefunc] = count(); }'

# Syscall count by process:
dtrace -n 'syscall:::entry { @num[pid,execname] = count(); }'

# Read bytes by process:
dtrace -n 'sysinfo:::readch { @bytes[execname] = sum(arg0); }'

# Write bytes by process:
dtrace -n 'sysinfo:::writech { @bytes[execname] = sum(arg0); }'

# Read size distribution by process:
dtrace -n 'sysinfo:::readch { @dist[execname] = quantize(arg0); }'

# Write size distribution by process:
dtrace -n 'sysinfo:::writech { @dist[execname] = quantize(arg0); }'

# Disk size by process:
dtrace -n 'io:::start { printf("%d %s %d",pid,execname,args[0]->b_bcount); }'

# Pages paged in by process:
dtrace -n 'vminfo:::pgpgin { @pg[execname] = sum(arg0); }'

# Minor faults by process:
dtrace -n 'vminfo:::as_fault { @mem[execname] = sum(arg0); }'

# Profile user-level stacks at 99 Hertz, for PID 189:
dtrace -n 'profile-99 /pid == 189 && arg1/ { @[ustack()] = count(); }'
There are also many one-liners in the DTrace book, and as Appendix D of the Systems Performance book.
Scripts
The following demonstrates the operation of each of the programs with a link to download the code. (Note: to get the newest version of a particular script, also check the version in the DTraceToolkit).iosnoop is a program to snoop disk I/O activity. Here we can watch live what is happening on our disks, including the PID and command responsible. The output includes the block address and size of the disk operation - for the first time you can watch live what the disks are up to.
# iosnoop
  UID   PID D    BLOCK   SIZE       COMM PATHNAME
  100 15795 R     3808   8192        tar /usr/bin/eject
  100 15795 R    35904   6144        tar /usr/bin/eject
  100 15795 R    39828   6144        tar /usr/bin/env
  100 15795 R     3872   8192        tar /usr/bin/expr
  100 15795 R    21120   7168        tar /usr/bin/expr
  100 15795 R    43680   6144        tar /usr/bin/false
  100 15795 R    44176   6144        tar /usr/bin/fdetach
  100 15795 R     3920   8192        tar /usr/bin/fdformat
  100 15795 R     3936   8192        tar /usr/bin/fdformat
  100 15795 R     4080   8192        tar /usr/bin/fdformat
  100 15795 R     9680   3072        tar /usr/bin/fdformat
[...]
The following illustrates disk activity caused by familiar Unix commands. iosnoop was executed on a Solaris 10 x86 server and the data was plotted - disk head location (red) and transfer size (blue). Click for larger versions:
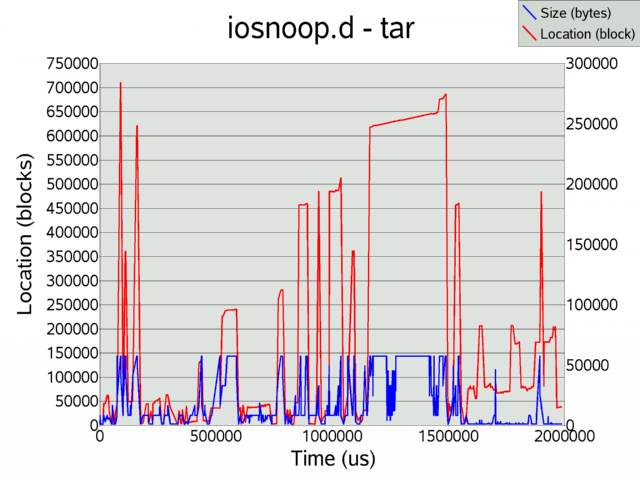
Here a tar command was executed (tar cvf /dev/null /var) to archive a directory, while iosnoop captured the first 2 seconds of disk activity. Some scattered activity is observed while tar is reading through directories, and sequential transfers can be observed as tar encounters large files.
- More iosnoop examples contains more demonstrations and plots.
- Standalone iosnoop.d is a DTrace only version with examples here, and the old pre-io provider iosnoop.d is here.
- psio is another DTrace enabled disk I/O tool.
iotop display top disk I/O events by process. This tracks disk I/O by process, and prints a summary report that is refreshed every interval. Full example. first release. check for updates.
# iotop -C
Sampling... Please wait.
2005 Jul 16 00:31:38,  load: 1.03,  disk_r:   5023 Kb,  disk_w:     22 Kb

  UID    PID   PPID CMD              DEVICE  MAJ MIN D            BYTES
    0  27740  20320 tar              cmdk0   102  16 W            23040
    0  27739  20320 find             cmdk0   102   0 R           668672
    0  27740  20320 tar              cmdk0   102  16 R          1512960
    0  27740  20320 tar              cmdk0   102   3 R          3108864

2005 Jul 16 00:31:43,  load: 1.06,  disk_r:   8234 Kb,  disk_w:      0 Kb

  UID    PID   PPID CMD              DEVICE  MAJ MIN D            BYTES
    0  27739  20320 find             cmdk0   102   0 R          1402880
    0  27740  20320 tar              cmdk0   102   3 R          7069696
[...]
execsnoop is a program to snoop process activity. As processes are executed on the server their details are printed out. Another user was logged in running a few commands which can be seen below. This is especially useful in troubleshooting short lived processes that are otherwise hard to spot. More examples.
# execsnoop
  UID   PID  PPID CMD
  100  3008  2656 ls
  100  3009  2656 ls -l
  100  3010  2656 cat /etc/passwd
  100  3011  2656 vi /etc/hosts
  100  3012  2656 date
  100  3013  2656 ls -l
  100  3014  2656 ls
  100  3015  2656 finger
[...]
- Execsnoop has options to add the date and time (-v), or watch a particular command (-c command).
- Standalone execsnoop.d is the original DTrace only version.
- C version: execsnoop.c was written to compare the overheads between a libdtrace C consumer and a D script.
opensnoop is a program to snoop file opens. The filename and file handle are traced along with some process details. More examples.
# opensnoop -g
  UID   PID PATH                                   FD ARGS
  100  3528 /var/ld/ld.config                      -1 cat /etc/passwd
  100  3528 /usr/lib/libc.so.1                      3 cat /etc/passwd
  100  3528 /etc/passwd                             3 cat /etc/passwd
  100  3529 /var/ld/ld.config                      -1 cal
  100  3529 /usr/lib/libc.so.1                      3 cal
  100  3529 /usr/share/lib/zoneinfo/Australia/NSW   3 cal
  100  3530 /var/ld/ld.config                      -1 ls -l
  100  3530 /usr/lib/libc.so.1                      3 ls -l
  100  3530 /var/run/name_service_door              3 ls -l
  100  3530 /usr/share/lib/zoneinfo/Australia/NSW   4 ls -l
  100  3531 /var/ld/ld.config                      -1 uname -a
  100  3531 /usr/lib/libc.so.1                      3 uname -a
[...]
- Opensnoop has options to add the date and time (-v), or watch a particular filename (-f pathname).
- Standalone opensnoop.d is the original DTrace only version..
rwsnoop snoop read/write events. This is measuring reads and writes at the application level - syscalls. Full example.
# rwsnoop
  UID    PID CMD          D   BYTES FILE
    0   2924 sh           R     128 /etc/profile
    0   2924 sh           R     128 /etc/profile
    0   2924 sh           R     128 /etc/profile
    0   2924 sh           R      84 /etc/profile
    0   2925 quota        R     757 /etc/nsswitch.conf
    0   2925 quota        R       0 /etc/nsswitch.conf
    0   2925 quota        R     668 /etc/passwd
    0   2926 cat          R      55 /etc/motd
    0   2926 cat          W      55 /devices/pseudo/pts@0:12
  100  20334 sshd         R      56 /devices/pseudo/clone@0:ptm
  100  20334 sshd         W     100 <unknown>
    0   2926 cat          R       0 /etc/motd
    0   2927 mail         R     757 /etc/nsswitch.conf
    0   2927 mail         R       0 /etc/nsswitch.conf
    0   2927 mail         R     275 /etc/group
    0   2927 mail         R     668 /etc/passwd
    0   2924 sh           R       0 /etc/profile
[...]
rwtop display top read/write bytes by process. rwtop prints a summary report that is refreshed at intervals. This is measuring reads and writes at the application level - syscalls. Full example.
# rwtop
2005 Jul 24 05:00:13,  load: 1.01,  app_r:     38 Kb,  app_w:      8 Kb

  UID    PID   PPID CMD              D            BYTES
    0    245      1 utmpd            R                4
    0  20320  20347 bash             R               21
  100  20317  20314 sshd             R               26
  100  20317  20314 sshd             W               68
    0   2934  20320 ps               W              140
    0  20320  20347 bash             W              216
    0      7      1 svc.startd       R              672
    0   2935  20320 df               W             1225
    0   2936  20320 ls               W             1466
    0   2936  20320 ls               R             2485
  100  20334  20331 sshd             R             4241
  100  20334  20331 sshd             W             5717
    0   2934  20320 ps               R            31567
tcpsnoop snoop TCP network packets by process. This analyses TCP network packets and prints the responsible PID and UID, plus standard details such as IP address and port. This captures traffic of newly created TCP connections that were established while this program was running. It can help identify which processes is causing TCP traffic. Full example. new release. check for updates.
# tcpsnoop.d
  UID    PID LADDR           LPORT DR RADDR           RPORT  SIZE CMD
  100  20892 192.168.1.5     36398 -> 192.168.1.1        79    54 finger
  100  20892 192.168.1.5     36398 -> 192.168.1.1        79    54 finger
  100  20892 192.168.1.5     36398 <- 192.168.1.1        79    54 finger
    0    242 192.168.1.5        23 <- 192.168.1.1     54224    54 inetd
    0    242 192.168.1.5        23 -> 192.168.1.1     54224    54 inetd
    0    242 192.168.1.5        23 <- 192.168.1.1     54224    54 inetd
    0    242 192.168.1.5        23 <- 192.168.1.1     54224    78 inetd
    0    242 192.168.1.5        23 -> 192.168.1.1     54224    54 inetd
    0  20893 192.168.1.5        23 -> 192.168.1.1     54224    57 in.telnetd
    0  20893 192.168.1.5        23 <- 192.168.1.1     54224    54 in.telnetd
    0  20893 192.168.1.5        23 -> 192.168.1.1     54224    78 in.telnetd
    0  20893 192.168.1.5        23 <- 192.168.1.1     54224    57 in.telnetd
    0  20893 192.168.1.5        23 -> 192.168.1.1     54224    54 in.telnetd
[...]
- Standalone tcpsnoop.d is a DTrace only version..
tcptop display top TCP network packets by process. This captures traffic of newly created TCP connections that were established while this program was running. It can help identify which processes is causing TCP traffic. Full example. first release. check for updates.
# tcptop -C 30
Sampling... Please wait.
2005 Jul  5 05:18:56,  load: 1.07,  TCPin:      3 Kb,  TCPout:    112 Kb

 UID    PID LADDR           LPORT RADDR           RPORT      SIZE NAME
   0    242 192.168.1.5        79 192.168.1.1     54283       272 inetd
   0    242 192.168.1.5        23 192.168.1.1     54284       294 inetd
   0  20929 192.168.1.5        79 192.168.1.1     54283       714 in.fingerd
 100  20926 192.168.1.5     36409 192.168.1.1        79      1160 finger
 100  20927 192.168.1.5     36410 192.168.1.1        79      1160 finger
 100  20928 192.168.1.5     36411 192.168.1.1        23      1627 telnet
   0  20313 192.168.1.5        22 192.168.1.1     54285      2798 sshd
   0  20931 192.168.1.5        23 192.168.1.1     54284      4622 in.telnetd
 100  20941 192.168.1.5       858 192.168.1.1       514    115712 rcp

2005 Jul  5 05:19:26,  load: 1.04,  TCPin:      0 Kb,  TCPout:      4 Kb

 UID    PID LADDR           LPORT RADDR           RPORT      SIZE NAME
 100  20942 192.168.1.5     36412 192.168.1.1        79      1160 finger
   0  20931 192.168.1.5        23 192.168.1.1     54284      7411 in.telnetd
[...]
udpsnoop.d snoop UDP network I/O by process. This analyses UCP network I/O and prints the responsible PID and UID, plus standard details such as IP address and port. This tracks UDP read/writes by payload. Full example. first release! check for updates.
# udpsnoop.d
  UID    PID LADDR           LPORT DR RADDR           RPORT  SIZE CMD
    0  27127 192.168.1.5     35534 -> 192.168.1.1        53    29 nslookup
    0  27127 192.168.1.5     35534 <- 192.168.1.1        53   181 nslookup
    1    221 192.168.1.5       111 <- 192.168.1.1     37524    56 rpcbind
    1    221 192.168.1.5       111 -> 192.168.1.1     37524    28 rpcbind
    0  27128 192.168.1.5     35116 <- 192.168.1.1     37524    40 rpc.sprayd
    0  27128 192.168.1.5     35116 -> 192.168.1.1     37524    24 rpc.sprayd
    0  27128 192.168.1.5     35116 <- 192.168.1.1     37524    44 rpc.sprayd
    0  27128 192.168.1.5     35116 <- 192.168.1.1     37524    44 rpc.sprayd
    0  27128 192.168.1.5     35116 <- 192.168.1.1     37524    44 rpc.sprayd
    0  27128 192.168.1.5     35116 <- 192.168.1.1     37524    44 rpc.sprayd
    0  27128 192.168.1.5     35116 <- 192.168.1.1     37524    44 rpc.sprayd
    0  27128 192.168.1.5     35116 <- 192.168.1.1     37524    44 rpc.sprayd
    0  27128 192.168.1.5     35116 <- 192.168.1.1     37524    44 rpc.sprayd
    0  27128 192.168.1.5     35116 <- 192.168.1.1     37524    44 rpc.sprayd
    0  27128 192.168.1.5     35116 <- 192.168.1.1     37524    44 rpc.sprayd
    0  27128 192.168.1.5     35116 <- 192.168.1.1     37524    44 rpc.sprayd
    0  27128 192.168.1.5     35116 <- 192.168.1.1     37524    40 rpc.sprayd
    0  27128 192.168.1.5     35116 -> 192.168.1.1     37524    36 rpc.sprayd
^C
connections snoop inbound TCP connections as they are established, displaying the server process that accepted the connection. Full example is here.
# connections
  UID   PID CMD          TYPE  PORT IP_SOURCE
    0   242 inetd         tcp    79 192.168.1.1
    0   359 sshd          tcp    22 192.168.1.1
  100  1532 Xorg          tcp  6000 192.168.1.1
^C
prustat This displays %CPU, %Mem, %Disk and %Net utilisation by process. To examine all four key performance areas by process in Solaris was prohibitivly difficult without DTrace. prustat also uses Perl, Kstat and the procfs structures from /proc/*/*. It is a new tool and still under development, released as a demonstration. Full example.
# prustat -t5 5
  PID   %CPU   %Mem  %Disk   %Net  COMM
22301  65.01   3.17   0.00   0.00  setiathome
  440   8.91  45.39   0.00   0.00  Xsun
 2618   0.33  14.34   0.00   0.00  mozilla-bin
  582   4.01   2.16   0.00   0.00  gnome-terminal
  574   1.80   1.31   0.00   0.00  metacity
  PID   %CPU   %Mem  %Disk   %Net  COMM
22694   3.74   0.20  74.47   0.00  tar
22301  66.70   3.17   0.00   0.00  setiathome
  440   6.67  45.39   0.00   0.00  Xsun
 2618   0.33  14.34   0.00   0.00  mozilla-bin
22693   3.81   1.50   0.00   0.00  dtrace
  PID   %CPU   %Mem  %Disk   %Net  COMM
22301  63.72   3.17   0.00   0.00  setiathome
  440   8.14  45.39   0.00   0.00  Xsun
22694   6.47   0.20  36.47   0.00  tar
22698   0.00   0.00   6.88  22.43  rcp
 2618   0.34  14.34   0.00   0.00  mozilla-bin
^C
dtruss This is a DTrace version of truss, designed to be less of a burden and safer than truss. In the below example, dtruss examines all processes named "bash" and prints out regular truss output plus elapsed and overhead times. See the full example.
# dtruss -eon bash
PID/LWP    ELAPSD OVERHD SYSCALL(args)           = return
 3911/1:       41     26 write(0x2, "l\0", 0x1)          = 1 0
 3911/1:  1001579     43 read(0x0, "s\0", 0x1)           = 1 0
 3911/1:       38     26 write(0x2, "s\0", 0x1)          = 1 0
 3911/1:  1019129     43 read(0x0, " \001\0", 0x1)               = 1 0
 3911/1:       38     26 write(0x2, " \0", 0x1)          = 1 0
 3911/1:   998533     43 read(0x0, "-\0", 0x1)           = 1 0
 3911/1:       38     26 write(0x2, "-\001\0", 0x1)              = 1 0
 3911/1:  1094323     42 read(0x0, "l\0", 0x1)           = 1 0
 3911/1:       39     27 write(0x2, "l\001\0", 0x1)              = 1 0
 3911/1:  1210496     44 read(0x0, "\r\0", 0x1)          = 1 0
[...]
procsystime This program provides process system call details such as elapsed time from entry to return, overhead time for CPU time consumed, and counts. In the example below we examine "ssh" processes. Full example.
# procsystime -a -n ssh
Hit Ctrl-C to stop sampling...
^C

Elapsed Times for process ssh,

         SYSCALL          TIME (ns)
            read             295392
           write             622903
         pollsys         1030310531

CPU Times for process ssh,

         SYSCALL          TIME (ns)
            read             183515
           write             534289
         pollsys             650729

Syscall Counts for process ssh,

         SYSCALL              COUNT
            read                 12
           write                 12
         pollsys                 24
hotuser Sample on-CPU user-level functions and libraries. This samples at 1000 Hertz, for a simple yet effective user-level profiling tool. The output will identify which function is on the CPU the most - which is the hottest. The following examples show hotuser analysing gunzip and gzip. Full example.
# ./hotuser -c 'gunzip contents.gz'
Sampling... Hit Ctrl-C to end.

FUNCTION                                                COUNT   PCNT
libc.so.1`_free_unlocked                                    1   0.1%
gunzip`unzip                                                1   0.1%
ld.so.1`strcmp                                              1   0.1%
gunzip`inflate_dynamic                                      1   0.1%
libc.so.1`_write                                            1   0.1%
gunzip`write_buf                                            1   0.1%
gunzip`0x2d990                                              2   0.3%
libc.so.1`write                                             2   0.3%
gunzip`0x2d994                                              2   0.3%
ld.so.1`rtld_db_preinit                                     3   0.4%
gunzip`0x2d98c                                              7   0.9%
gunzip`huft_build                                           9   1.2%
libc_psr.so.1`memcpy                                      138  18.5%
gunzip`inflate_codes                                      233  31.2%
gunzip`updcrc                                             344  46.1%


# ./hotuser -lc 'gzip contents'
Sampling... Hit Ctrl-C to end.

LIBRARY                                                 COUNT   PCNT
libc.so.1                                                   2   0.0%
libc_psr.so.1                                              37   0.9%
gzip                                                     4113  99.1%
hotkernel Sample on-CPU kernel-level functions and modules. This samples at 1000 Hertz, for a simple yet effective modules-level profiling tool. The output will identify which function is on the CPU the most - which is the hottest. The following examples show hotkernel analyse an x86 kernel. Full example.
# ./hotkernel
Sampling... Hit Ctrl-C to end.
^C
FUNCTION                                                COUNT   PCNT
unix`swtch                                                  1   0.1%
pcplusmp`apic_redistribute_compute                          1   0.1%
genunix`strrput                                             1   0.1%
unix`sys_call                                               1   0.1%
genunix`fsflush_do_pages                                    1   0.1%
TS`ts_wakeup                                                1   0.1%
genunix`callout_schedule_1                                  1   0.1%
unix`page_create_putback                                    1   0.1%
unix`mutex_enter                                            4   0.3%
unix`cpu_halt                                            1575  99.2%

# ./hotkernel -m
Sampling... Hit Ctrl-C to end.
^C
MODULE                                                  COUNT   PCNT
usbms                                                       1   0.0%
specfs                                                      1   0.0%
uhci                                                        1   0.0%
sockfs                                                      2   0.0%
genunix                                                    28   0.6%
unix                                                     4539  99.3%
dapptrace This traces user and library function usage. This is similar to the "apptrace" command, however can fetch extra details such as function elapsed times and on-cpu times. Below is a demonstration of running dapptrace on the banner command, the user function calls are being traced. Full example.
# dapptrace -eoF banner hi

 #    #     #
 #    #     #
 ######     #
 #    #     #
 #    #     #
 #    #     #

 ELAPSD    CPU CALL(args)             = return
      .      .   -> __fsr(0x2, 0x8047D7C, 0x8047D88)
     41      4   <- __fsr = 122
      .      .   -> main(0x2, 0x8047D7C, 0x8047D88)
      .      .     -> banner(0x8047E3B, 0x80614C2, 0x8047D38)
      .      .       -> banset(0x20, 0x80614C2, 0x8047DCC)
     29      6       <- banset = 36
      .      .       -> convert(0x68, 0x8047DCC, 0x2)
     26      3       <- convert = 319
      .      .       -> banfil(0x8061412, 0x80614C2, 0x8047DCC)
     25      2       <- banfil = 57
      .      .       -> convert(0x69, 0x8047DCC, 0x2)
     23      1       <- convert = 319
      .      .       -> banfil(0x8061419, 0x80614CA, 0x8047DCC)
     23      1       <- banfil = 57
    309     28     <- banner = 118
      .      .     -> banprt(0x80614C2, 0x8047D38, 0xD27FB824)
    349    322     <- banprt = 74
dappprof This profiles user and library function usage. This is a companion to dapptrace, where summary data is printed rather than a snoop of events. Below is a demonstration of running dappprof on the banner command. Full example.
# dappprof -ceoT banner hello

 #    #  ######  #       #        ####
 #    #  #       #       #       #    #
 ######  #####   #       #       #    #
 #    #  #       #       #       #    #
 #    #  #       #       #       #    #
 #    #  ######  ######  ######   ####


CALL                                                         COUNT
__fsr                                                            1
main                                                             1
banprt                                                           1
banner                                                           1
banset                                                           1
convert                                                          5
banfil                                                           5
TOTAL:                                                          15

CALL                                                       ELAPSED
banset                                                       38733
banfil                                                      150280
convert                                                     152113
banner                                                      907212
__fsr                                                      1695068
banprt                                                     1887674
TOTAL:                                                     4831080

CALL                                                           CPU
banset                                                        7710
convert                                                       9566
banfil                                                       11931
__fsr                                                        15199
banner                                                       52685
banprt                                                      776429
TOTAL:                                                      873520
dvmstat This program provides vmstat like data for one particular PID, a process name, or when running a command. It prints statistics every second. Here we monitor a "find" processes, and can clearly see it exhaust the cache (dropping "re" reclaims), and then defer to disk (increasing "maj" major faults and "fpi" filesystem pageins). Full example.
# dvmstat -n find
    re   maj    mf   fr  epi  epo  api  apo  fpi  fpo     sy
     0     0     0    0    0    0    0    0    0    0      0
     0     0     0    0    0    0    0    0    0    0      0
  6336     0   372    0    0    0    0    0    0    0  22255
  1624     0     0    0    0    0    0    0    0    0   5497
  2292     0     0    0    0    0    0    0    0    0   7715
 13064     0     0    0    0    0    0    0    0    0  43998
  7972   168     0    0    0    0    0    0  168    0  38361
   468   636     0    0    0    0    0    0  636    0  13774
   376   588     0    0    0    0    0    0  588    0  10723
    80   636     0    0    0    0    0    0  656    0  11078
    48   772     0    0    0    0    0    0  812    0   9841
    16  1028     0    0    0    0    0    0 1056    0  10752
     0  1712     0    0    0    0    0    0 1740    0  12176
     4  1224     0    0    0    0    0    0 1236    0   9024
topsyscall This program continually prints a report of the top system calls, and refreshes the display every 1 second or as specified. Full example.
2005 Jun 14 02:26:40, load average: 0.16, 0.18, 0.21   syscalls: 1381

   SYSCALL                          COUNT
   waitsys                              5
   getuid                               5
   xstat                                7
   munmap                               7
   brk                                  8
   sysconfig                            8
   open                                 8
   getpid                               9
   close                                9
   resolvepath                         10
   setcontext                          18
   setitimer                           25
   mmap                                26
   lwp_sigmask                         32
   lwp_park                            41
   write                               78
   read                                78
   sigaction                          113
   pollsys                            318
   ioctl                              526
shellsnoop captures the text input and output live from shells running on the system. In this example shellsnoop was run in one window, while in another several commands were run: date, cal and uname -a. (this is like a simple version of ttywatcher). Full example is here.
# shellsnoop
  PID  PPID      CMD DIR  TEXT
 4724  3762      ksh   R
 4724  3762      ksh   W  date

 4741  4724     date   W  Sun Mar 28 23:10:06 EST 2004
 4724  3762      ksh   R
 4724  3762      ksh   W  jupiter:/etc/init.d>
 4724  3762      ksh   R
 4724  3762      ksh   R
 4724  3762      ksh   W  cal

 4742  4724      cal   W     March 2004
 4742  4724      cal   W   S  M Tu  W Th  F  S
 4742  4724      cal   W      1  2  3  4  5  6
 4742  4724      cal   W   7  8  9 10 11 12 13
 4742  4724      cal   W  14 15 16 17 18 19 20
 4742  4724      cal   W  21 22 23 24 25 26 27
 4742  4724      cal   W  28 29 30 31
 4742  4724      cal   W
 4724  3762      ksh   R
 4724  3762      ksh   W  jupiter:/etc/init.d>
 4724  3762      ksh   R
 4724  3762      ksh   R
 4724  3762      ksh   W  uname -a

 4743  4724    uname   W  SunOS jupiter 5.10 s10_51 i86pc i386 i86pc
 4724  3762      ksh   R
- Shellsnoop has options to view a particular PID only, and to only view data printed - which is somewhat spooky.
- Standalone shellsnoop.d is the original DTrace only version..
kill.d This simple DTrace program watches who is sending signals to processes. In the example below, the bash shell successfully sent a "kill -2" (SIGINT) to PID 3117, and failed to send a "kill -9" (SIGKILL) to process 12345,
# kill.d
 FROM      COMMAND   SIG TO     RESULT
 2344         bash     2 3117   0
 2344         bash     9 12345  -1
^C
errinfo reports on system call failures with full errno details to help explain why these errors occured. It has two styles of output: a "snoop" style to watch events (the default), and a "count" style to provide a summary (-c). Both are demonstrated below, Full example.
# errinfo
            EXEC          SYSCALL  ERR  DESC
gnome-netstatus-            ioctl   12  Not enough core
     mozilla-bin         lwp_park   62  timer expired
            Xorg             read   11  Resource temporarily unavailable
            Xorg          pollsys    4  interrupted system call
     mozilla-bin         lwp_park   62  timer expired
     mozilla-bin         lwp_park   62  timer expired
            Xorg             read   11  Resource temporarily unavailable
^C
# errinfo -c
Sampling... Hit Ctrl-C to end.
^C
            EXEC          SYSCALL  ERR  COUNT  DESC
gnome-netstatus-            ioctl   12      1  Not enough core
     miniserv.pl          waitsys   10      1  No children
gnome-settings-d             read   11      1  Resource temporarily unavailable
        metacity             read   11      1  Resource temporarily unavailable
     gnome-panel             read   11      1  Resource temporarily unavailable
        nautilus             read   11      1  Resource temporarily unavailable
            dsdm             read   11      2  Resource temporarily unavailable
     soffice.bin             read   11      2  Resource temporarily unavailable
         java_vm    lwp_cond_wait   62      4  timer expired
      svc.startd           portfs   62      5  timer expired
            Xorg          pollsys    4     15  interrupted system call
            Xorg             read   11     26  Resource temporarily unavailable
     mozilla-bin         lwp_park   62     58  timer expired
sshkeysnoop.d captures the keystrokes from ssh client commands running on the same server. Although the password is clearly visible, this is not a security problem with Solaris 10 rather a demonstration of the power of DTrace. Full example.
# sshkeysnoop.d
  UID   PID  PPID  TYPE  TEXT
  100  9651  8600   cmd  ssh -l fred mars

  100  9651  8600   key  f
  100  9651  8600   key  r
  100  9651  8600   key  e
  100  9651  8600   key  d
  100  9651  8600   key  1
  100  9651  8600   key  2
  100  9651  8600   key  3
  100  9651  8600   key
[...]
shortlived.d This simple DTrace program measures how much time is consumed by short lived processes. This would normally be difficult to spot using sampling tools like prstat. In the example below, many short lived "expr" commands actually consume around 45% of the CPU. Full example here.
# shortlived.d
Sampling.. Hit Ctrl-C to stop.
^C
short lived processes:      3.394 secs
total sample duration:      7.543 secs

Total time by process name,
                ls           14 ms
                df           18 ms
              expr         3049 ms

Total time by PPID,
              2765           32 ms
             29752         3049 ms
cputimes print CPU time consumed by Kernel/Idle/Processes. The default output prints a breakdown of cpu time into three categories, Kernel time, Idle time and time consumed by processes; all in nanoseconds. Full example.
# cputimes 1 3
2005 Apr 27 23:37:58,
          KERNEL         10795499
         PROCESS         20941091
            IDLE        970707443
2005 Apr 27 23:37:59,
          KERNEL          8919418
         PROCESS         77446789
            IDLE        910555040
2005 Apr 27 23:38:00,
          KERNEL          8615123
         PROCESS         78314246
            IDLE        810100417
cpudists print CPU time distributions by Kernel/Idle/Processes. The default output prints a cpu time usage by three categories, Kernel time, Idle time and process time. The value is the time in nanosecounds, and the count is the number of occurances. Full example.
# cpudists 5 1
2005 Apr 28 00:08:42,
          KERNEL
           value  ------------- Distribution ------------- count
            4096 |                                         0
            8192 |@@@@@@@@@@@@@@@@@@@@@@@@@@@@             1134
           16384 |@@@@@@@@@                                344
           32768 |@@@                                      104
           65536 |                                         3
          131072 |                                         0

         PROCESS
           value  ------------- Distribution ------------- count
            8192 |                                         0
           16384 |@@@@@@@@@                                170
           32768 |@@@@@@@@@@@@@@@@@@                       331
           65536 |@@@@@@@@                                 152
          131072 |@                                        17
          262144 |@                                        25
          524288 |@                                        13
         1048576 |                                         4
         2097152 |                                         0

            IDLE
           value  ------------- Distribution ------------- count
         2097152 |                                         0
         4194304 |@                                        9
         8388608 |@@@@@@@@@@@@@@@@@@@@@@@@@@@@@@@@@@@@@    418
        16777216 |@@@                                      31
        33554432 |                                         0
setuids.d snoop setuid calls. This can be used to watch user logins, and "su" usage. Full example is here.
# setuids.d
  UID  SUID  PPID   PID PCMD         CMD
    0   100  3037  3040 in.telnetd   login -p -h mars -d /dev/pts/12
  100     0  3040  3045 bash         su -
    0   102  3045  3051 sh           su - fred
    0   100  3055  3059 sshd         /usr/lib/ssh/sshd
    0   100  3065  3067 in.rlogind   login -d /dev/pts/12 -r mars
    0   100  3071  3073 in.rlogind   login -d /dev/pts/12 -r mars
    0   102  3078  3081 in.telnetd   login -p -h mars -d /dev/pts/12
[...]
bitesize.d is a simple program to examine the way in which processes use the disks - are they causing large I/O operations or many small "bites"? In the example below we can see that the find command has caused mostly 1K events, while the tar command was transferring more data per operation. Full example.
# bitesize.d
Sampling... Hit Ctrl-C to end.
^C

     PID  CMD
    7109  find /

           value  ------------- Distribution ------------- count
             512 |                                         0
            1024 |@@@@@@@@@@@@@@@@@@@@@@@@@@@@@@@@@@       1452
            2048 |@@                                       91
            4096 |                                         33
            8192 |@@                                       97
           16384 |                                         0

       3  fsflush

           value  ------------- Distribution ------------- count
            4096 |                                         0
            8192 |@@@@@@@@@@@@@@@@@@@@@@@@@@@@@@@@@@@@@@@@ 449
           16384 |                                         0

    7108  tar cf /dev/null /

           value  ------------- Distribution ------------- count
             256 |                                         0
             512 |                                         70
            1024 |@@@@@@@@@@                               1306
            2048 |@@@@                                     569
            4096 |@@@@@@@@@                                1286
            8192 |@@@@@@@@@@                               1403
           16384 |@                                        190
           32768 |@@@                                      396
           65536 |                                         0
[...]
seeksize.d prints the disk head seek distance by process. This can identify whether processes are accessing the disks in a "random" or "sequential" manner. The example below illustrates sequential access. Use seeksize.d in conjunction with bitesize.d. Full example.
# seeksize.d
Sampling... Hit Ctrl-C to end.
^C

     PID  CMD
   22349  scp /dl/sol-10-b63-x86-v1.iso mars:

           value  ------------- Distribution ------------- count
              -1 |                                         0
               0 |@@@@@@@@@@@@@@@@@@@@@@@@@@@@@@@@@@@@@@   726
               1 |                                         0
               2 |                                         0
               4 |                                         0
               8 |@                                        13
              16 |                                         4
              32 |                                         0
[...]
zvmstat is a DTrace version of vmstat to print info per Zone. More examples here.
# zvmstat 1
      ZONE   re    mf   fr    sr  epi  epo  epf  api  apo  apf  fpi  fpo  fpf
    global   54   316    1     0    0    0    0    0    0    0    0    1    1
 workzone1    0     0    0     0    0    0    0    0    0    0    0    0    0
      ZONE   re    mf   fr    sr  epi  epo  epf  api  apo  apf  fpi  fpo  fpf
    global  157   659    1     0   10    0    0    0    0    0    3    2    1
 workzone1  770  1085    0     0   48    0    0    0    0    0  928    0    0
      ZONE   re    mf   fr    sr  epi  epo  epf  api  apo  apf  fpi  fpo  fpf
    global   56   317    0     0    6    0    0    0    0    0    2    0    0
 workzone1 1478    21    0     0    0    0    0    0    0    0 1635    0    0
[...]
zhostid is a DTrace daemon to change the host id to different values for each zone. More examples here.
global# ./zhostid &
[1] 8717
global# hostid
12345678
global#
global# zlogin workzone1
[Connected to zone 'workzone1' pts/10]
Last login: Tue Jun 21 03:51:10 on pts/10
Sun Microsystems Inc.   SunOS 5.10      Generic January 2005
#
# hostid
90abcdef
socketsnoop.d This program snoops socket data transfer events by process, identifying which process is responsible for reading or writing data on the network. Full example.
# socketsnoop.d
  UID   PID DIR  SIZE CMD
    0 19886   W    64 ssh mars
    0 19886   R    80 ssh mars
    0 19915   W     0 finger @mars
    0 19915   W     2 finger @mars
    0 19915   R   633 finger @mars
    0 19915   R     0 finger @mars
    0 19886   W    64 ssh mars
    0 19886   R    80 ssh mars
    0 19886   W    48 ssh mars
    0 19886   R    80 ssh mars
  100  4789   W     6 vncviewer mars:4
  100  4789   R   348 vncviewer mars:4
  100  4789   W    10 vncviewer mars:4
[...]
anonprofile.d is a program to snoop anonymous memory usage by process. This provides a profile of a process's anonymous memory size over time. It can assist troubleshooting memory issues during software development. More examples here.
# anonprofile.d
  UID   PID     TOTAL ARGS
    0 14380   4169728 /usr/sbin/dtrace -s anonprofile.d
  100 14382      4096 bash
  100 14382      8192 ls -l
  100 14382     12288 ls -l
  100 14382     20480 ls -l
  100 14382     24576 ls -l
  100 14382     28672 ls -l
  100 14382     57344 ls -l
  100 14382     65536 ls -l
  100 14382     73728 ls -l
  100 14382    106496 ls -l
  100 14382    110592 ls -l
  100 14382    118784 ls -l
  100 14382    126976 ls -l
  100 14382    131072 ls -l
  100 14382    135168 ls -l
  100 14382    143360 ls -l
[...]
intrtime Time spent by the kernel in interrupt threads was previously difficult to measure. intrtime gives a break down of the interrupt types and times spent servicing each. Full example.
# intrtime 1
   Interrupt         Time(ns)   %Time
   uhci_intr            23753    0.00
    ata_intr          3698089    0.37
  i8042_intr          7360399    0.73
    gld_intr         12319508    1.22
  TOTAL(int)         23401749    2.31
  TOTAL(dur)       1012546207  100.00
typewriter-0.75.tar.gz This makes your console keyboard sound like a mechanical keyboard. This is for entertainment only.
# ./ultra5.d &
[1] 7660
typewriter.d running for the console keyboard.
#
Troubleshooting Examples
These are examples of performing troubleshooting using DTrace, and often begin by using DTrace at the command line before using DTrace scripts such as the tools above.
DTrace vs truss this demonstrates the performace impact of using DTrace vs truss. DTrace is designed to minimise the burden on the system while it is running.
DTracing SMC here we have a quick look at using DTrace to investigate the behaviour of SMC when it is first executed. SMC is a system administration GUI that takes a while the first time it is run as it compiles Java classes.
DTracing Lost CPU here we take a look at a mysterious problem where the CPUs are busy, but there dosen't appear to be any processes responsible for this. Where has the CPU time gone?
prstat vs top this analyses the CPU overhead of running prstat vs running top. In the past some people have suggested that top is a CPU hog - DTrace can measure it.
DTraceTazTool
Several years ago, Richard McDougall wrote taztool - a GUI to display disk activity in an amazing and intuitive way. It used TNF trace data - a predecessor of DTrace. DTraceTazTool is a DTrace version of taztool. It is currently in development, and as such this is an alpha release. There are many more features to code, but it may already prove a useful tool.
The current version of DTraceTazTool is: DTaz-0.51.
The following image shows DTraceTazTool tracing the activity of a UFS file system as it was archived by the tar command. For the top plot: the requested block location is on the Y-axis, time is on the X-axis, and the colour reflects the number of requests for that location (many == red). The bottom plot shows maximum and average seek distance,
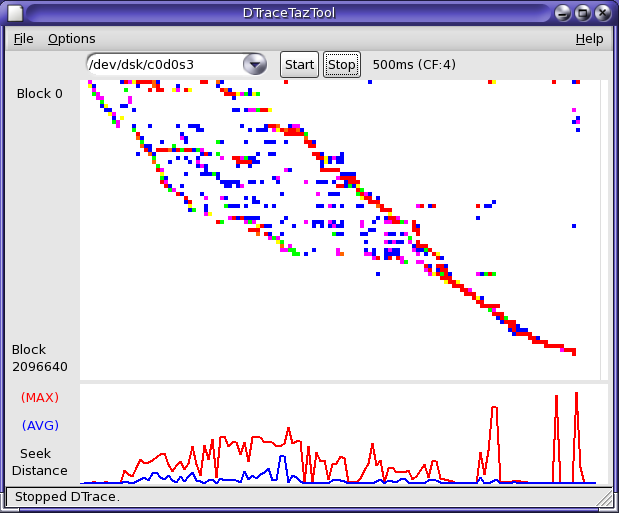
The thick red line is an indication of sequential disk activity, and the scattered blue blocks are an indication of random disk activity.
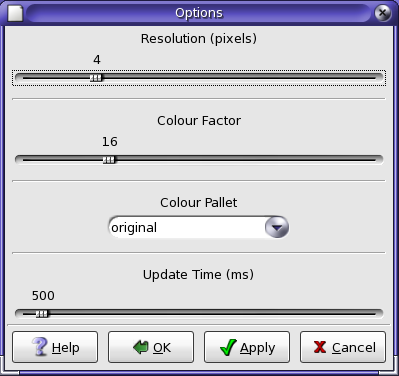
DTraceTazTool already has some tunable options, such as the size of the pixels drawn and the sample rate,
DTraceTazTool needs to either run as root, or as a user with the dtrace_kernel privilege.
DExplorer
dexplorer DExplorer automatically runs a collection of DTrace scripts to examine many areas of the system, and places the output in a meaningful directory structure that is tar'd and gzip'd. The following is an example of version 0.70. Full example.
# dexplorer
Output dir will be the current dir (/export/home/root/DTrace/Dexplorer).
Hit enter for yes, or type path:
Starting dexplorer ver 0.70.
Sample interval is 5 seconds. Total run is > 100 seconds.
  0% Interrupts by CPU...
  5% Interrupt counts...
 10% Dispatcher queue length by CPU...
 15% Sdt counts...
 20% Pages paged in by process name...
 25% Files opened count...
 30% Disk I/O size distribution by process name...
 35% Minor faults by process name...
 40% Vminfo data by process name...
 45% Mib data by mib statistic...
 50% TCP write bytes by process...
 55% Sample process @ 1000 Hz...
 60% Syscall count by process name...
 65% Syscall count by syscall...
 70% Read bytes by process name...
 75% Write bytes by process name...
 80% Sysinfo counts by process name...
 85% New process counts with arguments...
 90% Signal counts...
 95% Syscall error counts...
100% Done.
File is de_jupiter_200506271803.tar.gz
#
# ls -l de_jupiter_200506271803.tar.gz
-rw-r--r--   1 root     root        6346 Jun 27 18:05 de_jupiter_200506271803.tar.gz
The output file can be useful to send to other people for analysis.
Links
Books:
- DTrace: Dynamic Tracing in Oracle Solaris, Mac OS X and FreeBSD - Brendan Gregg, Jim Mauro (Prentice Hall, 2011).
- Solaris Performance and Tools: DTrace and MDB Techniques for Solaris 10 and OpenSolaris - Richard McDougall, Jim Mauro, Brendan Gregg (Prentice Hall, 2006).
- DTrace Guide - DTrace Team
Other DTrace scripts:
- DTrace book - scripts from the DTrace book.
- Solaris Internals - DTrace scripts by Richard McDougall.
External DTrace links:
- Brendan's blog - my professional blog (see dtrace tagged posts).
- The Wall - my personal blog, includes DTraceToolkit announcements.
- The Observation Deck - Bryan Cantrill's blog (DTrace Team).
- Adam Leventhal's Blog - (DTrace Team).
- $<blog - Mike Shapiro's blog (DTrace Team).
- Context-Switch DTrace - contains my workshop presentation slides.
- DTT Presentation - Stefan Parvu's DTrace and DTraceToolkit presentation.
- DTrace Community - (retired) OpenSolaris DTrace community website.
- BigAdmin DTrace - (retired) Sun's BigAdmin DTrace website.