

perf Examples
These are some examples of using the perf Linux profiler, which has also been called Performance Counters for Linux (PCL), Linux perf events (LPE), or perf_events. Like Vince Weaver, I'll call it perf_events so that you can search on that term later. Searching for just "perf" finds sites on the police, petroleum, weed control, and a T-shirt. This is not an official perf page, for either perf_events or the T-shirt.
perf_events is an event-oriented observability tool, which can help you solve advanced performance and troubleshooting functions. Questions that can be answered include:
- Why is the kernel on-CPU so much? What code-paths?
- Which code-paths are causing CPU level 2 cache misses?
- Are the CPUs stalled on memory I/O?
- Which code-paths are allocating memory, and how much?
- What is triggering TCP retransmits?
- Is a certain kernel function being called, and how often?
- What reasons are threads leaving the CPU?
perf_events is part of the Linux kernel, under tools/perf. While it uses many Linux tracing features, some are not yet exposed via the perf command, and need to be used via the ftrace interface instead. My perf-tools collection (github) uses both perf_events and ftrace as needed.
This page includes my examples of perf_events. A table of contents:
Key sections to start with are: Events, One-Liners, Presentations, Prerequisites, CPU statistics, Timed Profiling, and Flame Graphs. Also see my Posts about perf_events, and Links for the main (official) perf_events page, awesome tutorial, and other links. The next sections introduce perf_events further, starting with a screenshot, one-liners, and then background.
This page is under construction, and there's a lot more to perf_events that I'd like to add. Hopefully this is useful so far.
1. Screenshot
Starting with a screenshot, here's perf version 3.9.3 tracing disk I/O:
# perf record -e block:block_rq_issue -ag
^C
# ls -l perf.data
-rw------- 1 root root 3458162 Jan 26 03:03 perf.data
# perf report
[...]
# Samples: 2K of event 'block:block_rq_issue'
# Event count (approx.): 2216
#
# Overhead       Command      Shared Object                Symbol
# ........  ............  .................  ....................
#
    32.13%            dd  [kernel.kallsyms]  [k] blk_peek_request
                      |
                      --- blk_peek_request
                          virtblk_request
                          __blk_run_queue
                         |
                         |--98.31%-- queue_unplugged
                         |          blk_flush_plug_list
                         |          |
                         |          |--91.00%-- blk_queue_bio
                         |          |          generic_make_request
                         |          |          submit_bio
                         |          |          ext4_io_submit
                         |          |          |
                         |          |          |--58.71%-- ext4_bio_write_page
                         |          |          |          mpage_da_submit_io
                         |          |          |          mpage_da_map_and_submit
                         |          |          |          write_cache_pages_da
                         |          |          |          ext4_da_writepages
                         |          |          |          do_writepages
                         |          |          |          __filemap_fdatawrite_range
                         |          |          |          filemap_flush
                         |          |          |          ext4_alloc_da_blocks
                         |          |          |          ext4_release_file
                         |          |          |          __fput
                         |          |          |          ____fput
                         |          |          |          task_work_run
                         |          |          |          do_notify_resume
                         |          |          |          int_signal
                         |          |          |          close
                         |          |          |          0x0
                         |          |          |
                         |          |           --41.29%-- mpage_da_submit_io
[...]
A perf record command was used to trace the block:block_rq_issue probe, which fires when a block device I/O request is issued (disk I/O). Options included -a to trace all CPUs, and -g to capture call graphs (stack traces). Trace data is written to a perf.data file, and tracing ended when Ctrl-C was hit. A summary of the perf.data file was printed using perf report, which builds a tree from the stack traces, coalescing common paths, and showing percentages for each path.
The perf report output shows that 2,216 events were traced (disk I/O), 32% of which from a dd command. These were issued by the kernel function blk_peek_request(), and walking down the stacks, about half of these 32% were from the close() system call.
Note that I use the "#" prompt to signify that these commands were run as root, and I'll use "$" for user commands. Use sudo as needed.
2. One-Liners
Some useful one-liners I've gathered or written. Terminology I'm using, from lowest to highest overhead:
- statistics/count: increment an integer counter on events
- sample: collect details (eg, instruction pointer or stack) from a subset of events (once every ...)
- trace: collect details from every event
Listing Events
# Listing all currently known events:
perf list

# Listing sched tracepoints:
perf list 'sched:*'
Counting Events
# CPU counter statistics for the specified command:
perf stat command

# Detailed CPU counter statistics (includes extras) for the specified command:
perf stat -d command

# CPU counter statistics for the specified PID, until Ctrl-C:
perf stat -p PID

# CPU counter statistics for the entire system, for 5 seconds:
perf stat -a sleep 5

# Various basic CPU statistics, system wide, for 10 seconds:
perf stat -e cycles,instructions,cache-references,cache-misses,bus-cycles -a sleep 10

# Various CPU level 1 data cache statistics for the specified command:
perf stat -e L1-dcache-loads,L1-dcache-load-misses,L1-dcache-stores command

# Various CPU data TLB statistics for the specified command:
perf stat -e dTLB-loads,dTLB-load-misses,dTLB-prefetch-misses command

# Various CPU last level cache statistics for the specified command:
perf stat -e LLC-loads,LLC-load-misses,LLC-stores,LLC-prefetches command

# Using raw PMC counters, eg, counting unhalted core cycles:
perf stat -e r003c -a sleep 5

# PMCs: counting cycles and frontend stalls via raw specification:
perf stat -e cycles -e cpu/event=0x0e,umask=0x01,inv,cmask=0x01/ -a sleep 5

# Count syscalls per-second system-wide:
perf stat -e raw_syscalls:sys_enter -I 1000 -a

# Count system calls by type for the specified PID, until Ctrl-C:
perf stat -e 'syscalls:sys_enter_*' -p PID

# Count system calls by type for the entire system, for 5 seconds:
perf stat -e 'syscalls:sys_enter_*' -a sleep 5

# Count scheduler events for the specified PID, until Ctrl-C:
perf stat -e 'sched:*' -p PID

# Count scheduler events for the specified PID, for 10 seconds:
perf stat -e 'sched:*' -p PID sleep 10

# Count ext4 events for the entire system, for 10 seconds:
perf stat -e 'ext4:*' -a sleep 10

# Count block device I/O events for the entire system, for 10 seconds:
perf stat -e 'block:*' -a sleep 10

# Count all vmscan events, printing a report every second:
perf stat -e 'vmscan:*' -a -I 1000
Profiling
# Sample on-CPU functions for the specified command, at 99 Hertz:
perf record -F 99 command

# Sample on-CPU functions for the specified PID, at 99 Hertz, until Ctrl-C:
perf record -F 99 -p PID

# Sample on-CPU functions for the specified PID, at 99 Hertz, for 10 seconds:
perf record -F 99 -p PID sleep 10

# Sample CPU stack traces (via frame pointers) for the specified PID, at 99 Hertz, for 10 seconds:
perf record -F 99 -p PID -g -- sleep 10

# Sample CPU stack traces for the PID, using dwarf (dbg info) to unwind stacks, at 99 Hertz, for 10 seconds:
perf record -F 99 -p PID --call-graph dwarf sleep 10

# Sample CPU stack traces for the entire system, at 99 Hertz, for 10 seconds (< Linux 4.11):
perf record -F 99 -ag -- sleep 10

# Sample CPU stack traces for the entire system, at 99 Hertz, for 10 seconds (>= Linux 4.11):
perf record -F 99 -g -- sleep 10

# If the previous command didn't work, try forcing perf to use the cpu-clock event:
perf record -F 99 -e cpu-clock -ag -- sleep 10

# Sample CPU stack traces for a container identified by its /sys/fs/cgroup/perf_event cgroup:
perf record -F 99 -e cpu-clock --cgroup=docker/1d567f4393190204...etc... -a -- sleep 10

# Sample CPU stack traces for the entire system, with dwarf stacks, at 99 Hertz, for 10 seconds:
perf record -F 99 -a --call-graph dwarf sleep 10

# Sample CPU stack traces for the entire system, using last branch record for stacks, ... (>= Linux 4.?):
perf record -F 99 -a --call-graph lbr sleep 10

# Sample CPU stack traces, once every 10,000 Level 1 data cache misses, for 5 seconds:
perf record -e L1-dcache-load-misses -c 10000 -ag -- sleep 5

# Sample CPU stack traces, once every 100 last level cache misses, for 5 seconds:
perf record -e LLC-load-misses -c 100 -ag -- sleep 5

# Sample on-CPU kernel instructions, for 5 seconds:
perf record -e cycles:k -a -- sleep 5

# Sample on-CPU user instructions, for 5 seconds:
perf record -e cycles:u -a -- sleep 5

# Sample on-CPU user instructions precisely (using PEBS), for 5 seconds:
perf record -e cycles:up -a -- sleep 5

# Perform branch tracing (needs HW support), for 1 second:
perf record -b -a sleep 1

# Sample CPUs at 49 Hertz, and show top addresses and symbols, live (no perf.data file):
perf top -F 49

# Sample CPUs at 49 Hertz, and show top process names and segments, live:
perf top -F 49 -ns comm,dso
Static Tracing
# Trace new processes, until Ctrl-C:
perf record -e sched:sched_process_exec -a

# Sample (take a subset of) context-switches, until Ctrl-C:
perf record -e context-switches -a

# Trace all context-switches, until Ctrl-C:
perf record -e context-switches -c 1 -a

# Include raw settings used (see: man perf_event_open):
perf record -vv -e context-switches -a

# Trace all context-switches via sched tracepoint, until Ctrl-C:
perf record -e sched:sched_switch -a

# Sample context-switches with stack traces, until Ctrl-C:
perf record -e context-switches -ag

# Sample context-switches with stack traces, for 10 seconds:
perf record -e context-switches -ag -- sleep 10

# Sample CS, stack traces, and with timestamps (< Linux 3.17, -T now default):
perf record -e context-switches -ag -T

# Sample CPU migrations, for 10 seconds:
perf record -e migrations -a -- sleep 10

# Trace all connect()s with stack traces (outbound connections), until Ctrl-C:
perf record -e syscalls:sys_enter_connect -ag

# Trace all accepts()s with stack traces (inbound connections), until Ctrl-C:
perf record -e syscalls:sys_enter_accept* -ag

# Trace all block device (disk I/O) requests with stack traces, until Ctrl-C:
perf record -e block:block_rq_insert -ag

# Sample at most 100 block device requests per second, until Ctrl-C:
perf record -F 100 -e block:block_rq_insert -a

# Trace all block device issues and completions (has timestamps), until Ctrl-C:
perf record -e block:block_rq_issue -e block:block_rq_complete -a

# Trace all block completions, of size at least 100 Kbytes, until Ctrl-C:
perf record -e block:block_rq_complete --filter 'nr_sector > 200'

# Trace all block completions, synchronous writes only, until Ctrl-C:
perf record -e block:block_rq_complete --filter 'rwbs == "WS"'

# Trace all block completions, all types of writes, until Ctrl-C:
perf record -e block:block_rq_complete --filter 'rwbs ~ "*W*"'

# Sample minor faults (RSS growth) with stack traces, until Ctrl-C:
perf record -e minor-faults -ag

# Trace all minor faults with stack traces, until Ctrl-C:
perf record -e minor-faults -c 1 -ag

# Sample page faults with stack traces, until Ctrl-C:
perf record -e page-faults -ag

# Trace all ext4 calls, and write to a non-ext4 location, until Ctrl-C:
perf record -e 'ext4:*' -o /tmp/perf.data -a

# Trace kswapd wakeup events, until Ctrl-C:
perf record -e vmscan:mm_vmscan_wakeup_kswapd -ag

# Add Node.js USDT probes (Linux 4.10+):
perf buildid-cache --add `which node`

# Trace the node http__server__request USDT event (Linux 4.10+):
perf record -e sdt_node:http__server__request -a
Dynamic Tracing
# Add a tracepoint for the kernel tcp_sendmsg() function entry ("--add" is optional):
perf probe --add tcp_sendmsg

# Remove the tcp_sendmsg() tracepoint (or use "--del"):
perf probe -d tcp_sendmsg

# Add a tracepoint for the kernel tcp_sendmsg() function return:
perf probe 'tcp_sendmsg%return'

# Show available variables for the kernel tcp_sendmsg() function (needs debuginfo):
perf probe -V tcp_sendmsg

# Show available variables for the kernel tcp_sendmsg() function, plus external vars (needs debuginfo):
perf probe -V tcp_sendmsg --externs

# Show available line probes for tcp_sendmsg() (needs debuginfo):
perf probe -L tcp_sendmsg

# Show available variables for tcp_sendmsg() at line number 81 (needs debuginfo):
perf probe -V tcp_sendmsg:81

# Add a tracepoint for tcp_sendmsg(), with three entry argument registers (platform specific):
perf probe 'tcp_sendmsg %ax %dx %cx'

# Add a tracepoint for tcp_sendmsg(), with an alias ("bytes") for the %cx register (platform specific):
perf probe 'tcp_sendmsg bytes=%cx'

# Trace previously created probe when the bytes (alias) variable is greater than 100:
perf record -e probe:tcp_sendmsg --filter 'bytes > 100'

# Add a tracepoint for tcp_sendmsg() return, and capture the return value:
perf probe 'tcp_sendmsg%return $retval'

# Add a tracepoint for tcp_sendmsg(), and "size" entry argument (reliable, but needs debuginfo):
perf probe 'tcp_sendmsg size'

# Add a tracepoint for tcp_sendmsg(), with size and socket state (needs debuginfo):
perf probe 'tcp_sendmsg size sk->__sk_common.skc_state'

# Tell me how on Earth you would do this, but don't actually do it (needs debuginfo):
perf probe -nv 'tcp_sendmsg size sk->__sk_common.skc_state'

# Trace previous probe when size is non-zero, and state is not TCP_ESTABLISHED(1) (needs debuginfo):
perf record -e probe:tcp_sendmsg --filter 'size > 0 && skc_state != 1' -a

# Add a tracepoint for tcp_sendmsg() line 81 with local variable seglen (needs debuginfo):
perf probe 'tcp_sendmsg:81 seglen'

# Add a tracepoint for do_sys_open() with the filename as a string (needs debuginfo):
perf probe 'do_sys_open filename:string'

# Add a tracepoint for myfunc() return, and include the retval as a string:
perf probe 'myfunc%return +0($retval):string'

# Add a tracepoint for the user-level malloc() function from libc:
perf probe -x /lib64/libc.so.6 malloc

# Add a tracepoint for this user-level static probe (USDT, aka SDT event):
perf probe -x /usr/lib64/libpthread-2.24.so %sdt_libpthread:mutex_entry

# List currently available dynamic probes:
perf probe -l
Mixed
# Trace system calls by process, showing a summary refreshing every 2 seconds:
perf top -e raw_syscalls:sys_enter -ns comm

# Trace sent network packets by on-CPU process, rolling output (no clear):
stdbuf -oL perf top -e net:net_dev_xmit -ns comm | strings

# Sample stacks at 99 Hertz, and, context switches:
perf record -F99 -e cpu-clock -e cs -a -g

# Sample stacks to 2 levels deep, and, context switch stacks to 5 levels (needs 4.8):
perf record -F99 -e cpu-clock/max-stack=2/ -e cs/max-stack=5/ -a -g
Special
# Record cacheline events (Linux 4.10+):
perf c2c record -a -- sleep 10

# Report cacheline events from previous recording (Linux 4.10+):
perf c2c report
Reporting
# Show perf.data in an ncurses browser (TUI) if possible:
perf report

# Show perf.data with a column for sample count:
perf report -n

# Show perf.data as a text report, with data coalesced and percentages:
perf report --stdio

# Report, with stacks in folded format: one line per stack (needs 4.4):
perf report --stdio -n -g folded

# List all events from perf.data:
perf script

# List all perf.data events, with data header (newer kernels; was previously default):
perf script --header

# List all perf.data events, with customized fields (< Linux 4.1):
perf script -f time,event,trace

# List all perf.data events, with customized fields (>= Linux 4.1):
perf script -F time,event,trace

# List all perf.data events, with my recommended fields (needs record -a; newer kernels):
perf script --header -F comm,pid,tid,cpu,time,event,ip,sym,dso

# List all perf.data events, with my recommended fields (needs record -a; older kernels):
perf script -f comm,pid,tid,cpu,time,event,ip,sym,dso

# Dump raw contents from perf.data as hex (for debugging):
perf script -D

# Disassemble and annotate instructions with percentages (needs some debuginfo):
perf annotate --stdio
These one-liners serve to illustrate the capabilities of perf_events, and can also be used a bite-sized tutorial: learn perf_events one line at a time. You can also print these out as a perf_events cheatsheet.
3. Presentations
Kernel Recipes (2017)
At Kernel Recipes 2017 I gave an updated talk on Linux perf at Netflix, focusing on getting CPU profiling and flame graphs to work. This talk includes a crash course on perf_events, plus gotchas such as fixing stack traces and symbols when profiling Java, Node.js, VMs, and containers.
A video of the talk is on youtube and the slides are on slideshare:

There's also an older version of this talk from 2015, which I've posted about.
4. Background
The following sections provide some background for understanding perf_events and how to use it. I'll describe the prerequisites, audience, usage, events, and tracepoints.
4.1. Prerequisites
The perf tool is in the linux-tools-common package. Start by adding that, then running "perf" to see if you get the USAGE message. It may tell you to install another related package (linux-tools-kernelversion).
You can also build and add perf from the Linux kernel source. See the Building section.
To get the most out perf, you'll want symbols and stack traces. These may work by default in your Linux distribution, or they may require the addition of packages, or recompilation of the kernel with additional config options.
4.2. Symbols
perf_events, like other debug tools, needs symbol information (symbols). These are used to translate memory addresses into function and variable names, so that they can be read by us humans. Without symbols, you'll see hexadecimal numbers representing the memory addresses profiled.
The following perf report output shows stack traces, however, only hexadecimal numbers can be seen:
    57.14%     sshd  libc-2.15.so        [.] connect
               |
               --- connect
                  |
                  |--25.00%-- 0x7ff3c1cddf29
                  |
                  |--25.00%-- 0x7ff3bfe82761
                  |          0x7ff3bfe82b7c
                  |
                  |--25.00%-- 0x7ff3bfe82dfc
                   --25.00%-- [...]
If the software was added by packages, you may find debug packages (often "-dbgsym") which provide the symbols. Sometimes perf report will tell you to install these, eg: "no symbols found in /bin/dd, maybe install a debug package?".
Here's the same perf report output seen earlier, after adding openssh-server-dbgsym and libc6-dbgsym (this is on ubuntu 12.04):
    57.14%     sshd  libc-2.15.so        [.] __GI___connect_internal
               |
               --- __GI___connect_internal
                  |
                  |--25.00%-- add_one_listen_addr.isra.0
                  |
                  |--25.00%-- __nscd_get_mapping
                  |          __nscd_get_map_ref
                  |
                  |--25.00%-- __nscd_open_socket
                   --25.00%-- [...]
I find it useful to add both libc6-dbgsym and coreutils-dbgsym, to provide some symbol coverage of user-level OS codepaths.
Another way to get symbols is to compile the software yourself. For example, I just compiled node (Node.js):
# file node-v0.10.28/out/Release/node
node-v0.10.28/out/Release/node: ELF 64-bit LSB executable, ... not stripped
This has not been stripped, so I can profile node and see more than just hex. If the result is stripped, configure your build system not to run strip(1) on the output binaries.
Kernel-level symbols are in the kernel debuginfo package, or when the kernel is compiled with CONFIG_KALLSYMS.
4.3. JIT Symbols (Java, Node.js)
Programs that have virtual machines (VMs), like Java's JVM and node's v8, execute their own virtual processor, which has its own way of executing functions and managing stacks. If you profile these using perf_events, you'll see symbols for the VM engine, which have some use (eg, to identify if time is spent in GC), but you won't see the language-level context you might be expecting. Eg, you won't see Java classes and methods.
perf_events has JIT support to solve this, which requires the VM to maintain a /tmp/perf-PID.map file for symbol translation. Java can do this with perf-map-agent, and Node.js 0.11.13+ with --perf_basic_prof. See my blog post Node.js flame graphs on Linux for the steps.
Note that Java may not show full stacks to begin with, due to hotspot on x86 omitting the frame pointer (just like gcc). On newer versions (JDK 8u60+), you can use the -XX:+PreserveFramePointer option to fix this behavior, and profile fully using perf. See my Netflix Tech Blog post, Java in Flames, for a full writeup, and my Java flame graphs section, which links to an older patch and includes an example resulting flame graph. I also summarized the latest in my JavaOne 2016 talk Java Performance Analysis on Linux with Flame Graphs.
4.4 Stack Traces
Always compile with frame pointers. Omitting frame pointers is an evil compiler optimization that breaks debuggers, and sadly, is often the default. Without them, you may see incomplete stacks from perf_events, like seen in the earlier sshd symbols example. There are three ways to fix this: either using dwarf data to unwind the stack, using last branch record (LBR) if available (a processor feature), or returning the frame pointers.
There are other stack walking techniques, like BTS (Branch Trace Store), and the new ORC unwinder. I'll add docs for them at some point (and as perf support arrives).
Frame Pointers
The earlier sshd example was a default build of OpenSSH, which uses compiler optimizations (-O2), which in this case has omitted the frame pointer. Here's how it looks after recompiling OpenSSH with -fno-omit-frame-pointer:
    100.00%     sshd  libc-2.15.so   [.] __GI___connect_internal
               |
               --- __GI___connect_internal
                  |
                  |--30.00%-- add_one_listen_addr.isra.0
                  |          add_listen_addr
                  |          fill_default_server_options
                  |          main
                  |          __libc_start_main
                  |
                  |--20.00%-- __nscd_get_mapping
                  |          __nscd_get_map_ref
                  |
                  |--20.00%-- __nscd_open_socket
                   --30.00%-- [...]
Now the ancestry from add_one_listen_addr() can be seen, down to main() and __libc_start_main().
The kernel can suffer the same problem. Here's an example CPU profile collected on an idle server, with stack traces (-g):
    99.97%  swapper  [kernel.kallsyms]  [k] default_idle
            |
            --- default_idle

     0.03%     sshd  [kernel.kallsyms]  [k] iowrite16
               |
               --- iowrite16
                   __write_nocancel
                   (nil)
The kernel stack traces are incomplete. Now a similar profile with CONFIG_FRAME_POINTER=y:
    99.97%  swapper  [kernel.kallsyms]  [k] default_idle
            |
            --- default_idle
                cpu_idle
               |
               |--87.50%-- start_secondary
               |
                --12.50%-- rest_init
                          start_kernel
                          x86_64_start_reservations
                          x86_64_start_kernel

     0.03%     sshd  [kernel.kallsyms]  [k] iowrite16
               |
               --- iowrite16
                   vp_notify
                   virtqueue_kick
                   start_xmit
                   dev_hard_start_xmit
                   sch_direct_xmit
                   dev_queue_xmit
                   ip_finish_output
                   ip_output
                   ip_local_out
                   ip_queue_xmit
                   tcp_transmit_skb
                   tcp_write_xmit
                   __tcp_push_pending_frames
                   tcp_sendmsg
                   inet_sendmsg
                   sock_aio_write
                   do_sync_write
                   vfs_write
                   sys_write
                   system_call_fastpath
                   __write_nocancel
Much better -- the entire path from the write() syscall (__write_nocancel) to iowrite16() can be seen.
Dwarf
Since about the 3.9 kernel, perf_events has supported a workaround for missing frame pointers in user-level stacks: libunwind, which uses dwarf. This can be enabled using "--call-graph dwarf" (or "-g dwarf").
Also see the Building section for other notes about building perf_events, as without the right library, it may build itself without dwarf support.
LBR
You must have Last Branch Record access to be able to use this. It is disabled in most cloud environments, where you'll get this error:
# perf record -F 99 -a --call-graph lbr
Error:
PMU Hardware doesn't support sampling/overflow-interrupts.
Here's an example of it working:
# perf record -F 99 -a --call-graph lbr
^C[ perf record: Woken up 1 times to write data ]
[ perf record: Captured and wrote 0.903 MB perf.data (163 samples) ]
# perf script
[...]
stackcollapse-p 23867 [007] 4762187.971824:   29003297 cycles:ppp:
                  1430c0 Perl_re_intuit_start (/usr/bin/perl)
                  144118 Perl_regexec_flags (/usr/bin/perl)
                   cfcc9 Perl_pp_match (/usr/bin/perl)
                   cbee3 Perl_runops_standard (/usr/bin/perl)
                   51fb3 perl_run (/usr/bin/perl)
                   2b168 main (/usr/bin/perl)

stackcollapse-p 23867 [007] 4762187.980184:   31532281 cycles:ppp:
                   e3660 Perl_sv_force_normal_flags (/usr/bin/perl)
                  109b86 Perl_leave_scope (/usr/bin/perl)
                  1139db Perl_pp_leave (/usr/bin/perl)
                   cbee3 Perl_runops_standard (/usr/bin/perl)
                   51fb3 perl_run (/usr/bin/perl)
                   2b168 main (/usr/bin/perl)

stackcollapse-p 23867 [007] 4762187.989283:   32341031 cycles:ppp:
                   cfae0 Perl_pp_match (/usr/bin/perl)
                   cbee3 Perl_runops_standard (/usr/bin/perl)
                   51fb3 perl_run (/usr/bin/perl)
                   2b168 main (/usr/bin/perl)
Nice! Note that LBR is usually limited in stack depth (either 8, 16, or 32 frames), so it may not be suitable for deep stacks or flame graph generation, as flame graphs need to walk to the common root for merging.
Here's that same program sampled using the by-default frame pointer walk:
# perf record -F 99 -a -g
^C[ perf record: Woken up 1 times to write data ]
[ perf record: Captured and wrote 0.882 MB perf.data (81 samples) ]
# perf script
[...]
stackcollapse-p 23883 [005] 4762405.747834:   35044916 cycles:ppp:
                  135b83 [unknown] (/usr/bin/perl)

stackcollapse-p 23883 [005] 4762405.757935:   35036297 cycles:ppp:
                   ee67d Perl_sv_gets (/usr/bin/perl)

stackcollapse-p 23883 [005] 4762405.768038:   35045174 cycles:ppp:
                  137334 [unknown] (/usr/bin/perl)
You can recompile Perl with frame pointer support (in its ./Configure, it asks what compiler options: add -fno-omit-frame-pointer). Or you can use LBR if it's available, and you don't need very long stacks.
4.5. Audience
To use perf_events, you'll either:
- Develop your own commands
- Run example commands
Developing new invocations of perf_events requires the study of kernel and application code, which isn't for everyone. Many more people will use perf_events by running commands developed by other people, like the examples on this page. This can work out fine: your organization may only need one or two people who can develop perf_events commands or source them, and then share them for use by the entire operation and support groups.
Either way, you need to know the capabilities of perf_events so you know when to reach for it, whether that means searching for an example command or writing your own. One goal of the examples that follow is just to show you what can be done, to help you learn these capabilities. You should also browse examples on other sites (Links).
If you've never used perf_events before, you may want to test before production use (it has had kernel panic bugs in the past). My experience has been a good one (no panics).
4.6. Usage
perf_events provides a command line tool, perf, and subcommands for various profiling activities. This is a single interface for the different instrumentation frameworks that provide the various events.
The perf command alone will list the subcommands; here is perf version 4.10 (for the Linux 4.10 kernel):
# perf

 usage: perf [--version] [--help] [OPTIONS] COMMAND [ARGS]

 The most commonly used perf commands are:
   annotate        Read perf.data (created by perf record) and display annotated code
   archive         Create archive with object files with build-ids found in perf.data file
   bench           General framework for benchmark suites
   buildid-cache   Manage build-id cache.
   buildid-list    List the buildids in a perf.data file
   config          Get and set variables in a configuration file.
   data            Data file related processing
   diff            Read perf.data files and display the differential profile
   evlist          List the event names in a perf.data file
   inject          Filter to augment the events stream with additional information
   kmem            Tool to trace/measure kernel memory properties
   kvm             Tool to trace/measure kvm guest os
   list            List all symbolic event types
   lock            Analyze lock events
   mem             Profile memory accesses
   record          Run a command and record its profile into perf.data
   report          Read perf.data (created by perf record) and display the profile
   sched           Tool to trace/measure scheduler properties (latencies)
   script          Read perf.data (created by perf record) and display trace output
   stat            Run a command and gather performance counter statistics
   test            Runs sanity tests.
   timechart       Tool to visualize total system behavior during a workload
   top             System profiling tool.
   probe           Define new dynamic tracepoints
   trace           strace inspired tool

 See 'perf help COMMAND' for more information on a specific command.
Apart from separate help for each subcommand, there is also documentation in the kernel source under tools/perf/Documentation. perf has evolved, with different functionality added over time, so on an older kernel you may be missing some subcommands or functionality. Also, its usage may not feel consistent as you switch between activities. It's best to think of it as a multi-tool.
perf_events can instrument in three ways (now using the perf_events terminology):
- counting events in-kernel context, where a summary of counts is printed by perf. This mode does not generate a perf.data file.
- sampling events, which writes event data to a kernel buffer, which is read at a gentle asynchronous rate by the perf command to write to the perf.data file. This file is then read by the perf report or perf script commands.
- bpf programs on events, a new feature in Linux 4.4+ kernels that can execute custom user-defined programs in kernel space, which can perform efficient filters and summaries of the data. Eg, efficiently-measured latency histograms.
Try starting by counting events using the perf stat command, to see if this is sufficient. This subcommand costs the least overhead.
When using the sampling mode with perf record, you'll need to be a little careful about the overheads, as the capture files can quickly become hundreds of Mbytes. It depends on the rate of the event you are tracing: the more frequent, the higher the overhead and larger the perf.data size.
To really cut down overhead and generate more advanced summaries, write BPF programs executed by perf. See the eBPF section.
4.7. Usage Examples
These example sequences have been chosen to illustrate some different ways that perf is used, from gathering to reporting.
Performance counter summaries, including IPC, for the gzip command:
# perf stat gzip largefile
Count all scheduler process events for 5 seconds, and count by tracepoint:
# perf stat -e 'sched:sched_process_*' -a sleep 5
Trace all scheduler process events for 5 seconds, and count by both tracepoint and process name:
# perf record -e 'sched:sched_process_*' -a sleep 5
# perf report
Trace all scheduler process events for 5 seconds, and dump per-event details:
# perf record -e 'sched:sched_process_*' -a sleep 5
# perf script
Trace read() syscalls, when requested bytes is less than 10:
# perf record -e 'syscalls:sys_enter_read' --filter 'count < 10' -a
Sample CPU stacks at 99 Hertz, for 5 seconds:
# perf record -F 99 -ag -- sleep 5
# perf report
Dynamically instrument the kernel tcp_sendmsg() function, and trace it for 5 seconds, with stack traces:
# perf probe --add tcp_sendmsg
# perf record -e probe:tcp_sendmsg -ag -- sleep 5
# perf probe --del tcp_sendmsg
# perf report
Deleting the tracepoint (--del) wasn't necessary; I included it to show how to return the system to its original state.
Caveats
The use of -p PID as a filter doesn't work properly on some older kernel versions (Linux 3.x): perf hits 100% CPU and needs to be killed. It's annoying. The workaround is to profile all CPUs (-a), and filter PIDs later.
4.8. Special Usage
There's a number of subcommands that provide special purpose functionality. These include:
- perf c2c (Linux 4.10+): cache-2-cache and cacheline false sharing analysis.
- perf kmem: kernel memory allocation analysis.
- perf kvm: KVM virtual guest analysis.
- perf lock: lock analysis.
- perf mem: memory access analysis.
- perf sched: kernel scheduler statistics. Examples.
These make use of perf's existing instrumentation capabilities, recording selected events and reporting them in custom ways.
5. Events
perf_events instruments "events", which are a unified interface for different kernel instrumentation frameworks. The following map (from my SCaLE13x talk) illustrates the event sources:
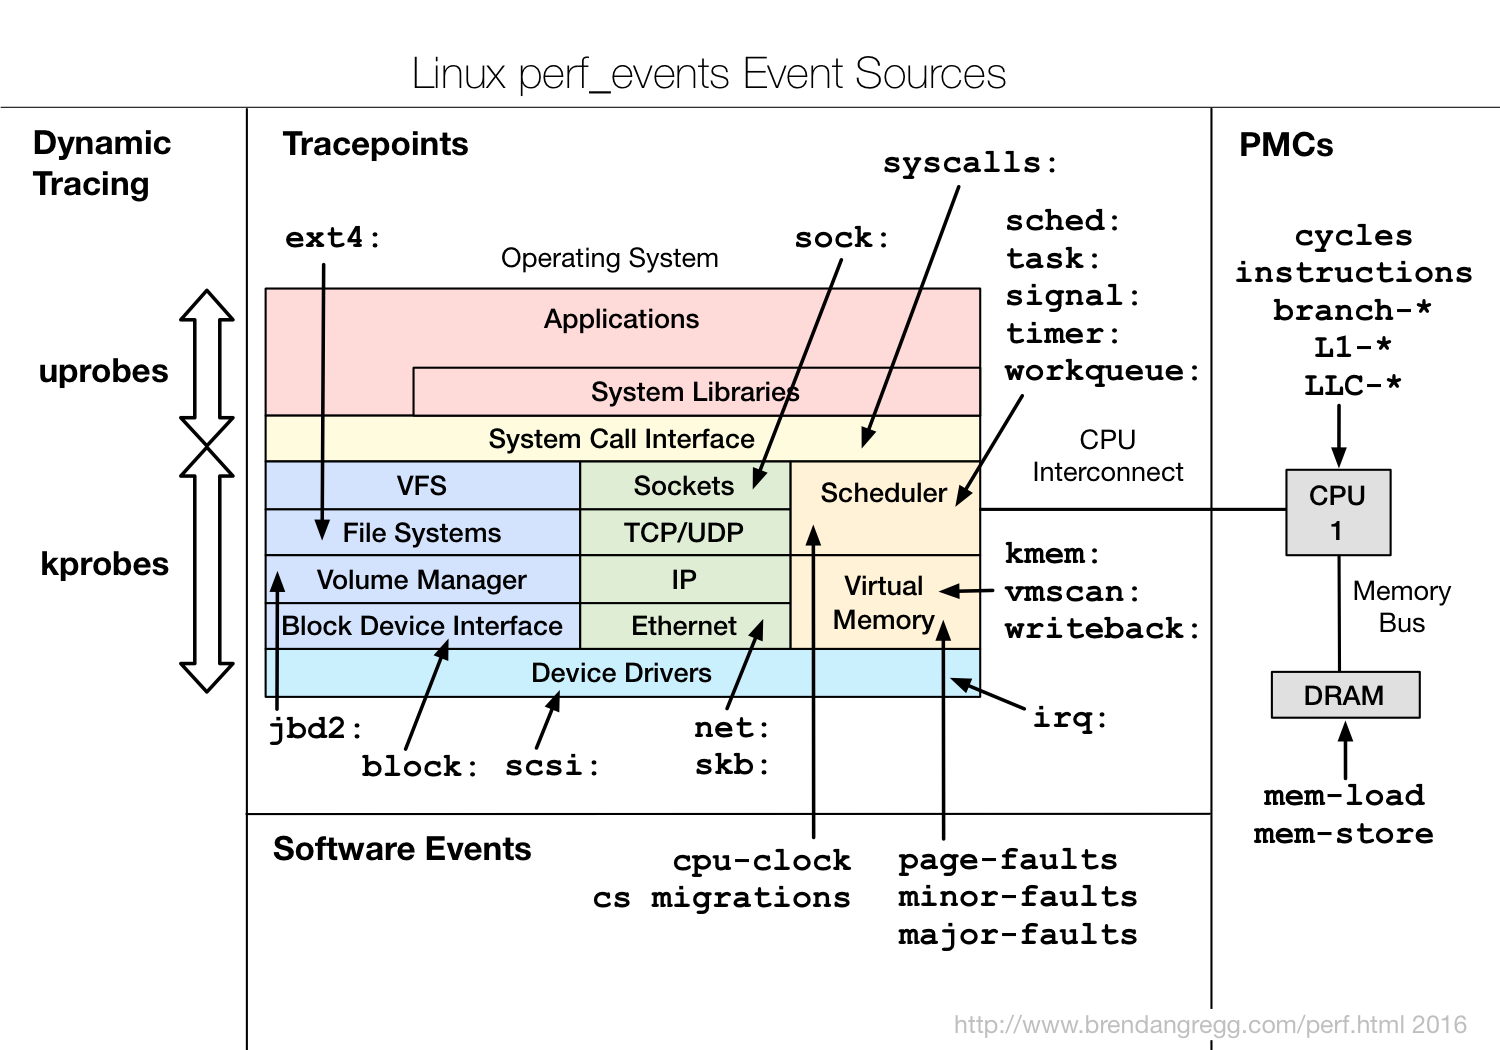
The types of events are:
- Hardware Events: CPU performance monitoring counters.
- Software Events: These are low level events based on kernel counters. For example, CPU migrations, minor faults, major faults, etc.
- Kernel Tracepoint Events: This are static kernel-level instrumentation points that are hardcoded in interesting and logical places in the kernel.
- User Statically-Defined Tracing (USDT): These are static tracepoints for user-level programs and applications.
- Dynamic Tracing: Software can be dynamically instrumented, creating events in any location. For kernel software, this uses the kprobes framework. For user-level software, uprobes.
- Timed Profiling: Snapshots can be collected at an arbitrary frequency, using perf record -FHz. This is commonly used for CPU usage profiling, and works by creating custom timed interrupt events.
Details about the events can be collected, including timestamps, the code path that led to it, and other specific details. The capabilities of perf_events are enormous, and you're likely to only ever use a fraction.
Currently available events can be listed using the list subcommand:
# perf list
List of pre-defined events (to be used in -e):
  cpu-cycles OR cycles                               [Hardware event]
  instructions                                       [Hardware event]
  cache-references                                   [Hardware event]
  cache-misses                                       [Hardware event]
  branch-instructions OR branches                    [Hardware event]
  branch-misses                                      [Hardware event]
  bus-cycles                                         [Hardware event]
  stalled-cycles-frontend OR idle-cycles-frontend    [Hardware event]
  stalled-cycles-backend OR idle-cycles-backend      [Hardware event]
  ref-cycles                                         [Hardware event]
  cpu-clock                                          [Software event]
  task-clock                                         [Software event]
  page-faults OR faults                              [Software event]
  context-switches OR cs                             [Software event]
  cpu-migrations OR migrations                       [Software event]
  minor-faults                                       [Software event]
  major-faults                                       [Software event]
  alignment-faults                                   [Software event]
  emulation-faults                                   [Software event]
  L1-dcache-loads                                    [Hardware cache event]
  L1-dcache-load-misses                              [Hardware cache event]
  L1-dcache-stores                                   [Hardware cache event]
[...]
  rNNN                                               [Raw hardware event descriptor]
  cpu/t1=v1[,t2=v2,t3 ...]/modifier                  [Raw hardware event descriptor]
   (see 'man perf-list' on how to encode it)
  mem:<addr>[:access]                                [Hardware breakpoint]
  probe:tcp_sendmsg                                  [Tracepoint event]
[...]
  sched:sched_process_exec                           [Tracepoint event]
  sched:sched_process_fork                           [Tracepoint event]
  sched:sched_process_wait                           [Tracepoint event]
  sched:sched_wait_task                              [Tracepoint event]
  sched:sched_process_exit                           [Tracepoint event]
[...]
# perf list | wc -l
     657
When you use dynamic tracing, you are extending this list. The probe:tcp_sendmsg tracepoint in this list is an example, which I added by instrumenting tcp_sendmsg(). Profiling (sampling) events are not listed.
5.1. Software Events
There is a small number of fixed software events provided by perf:
# perf list

List of pre-defined events (to be used in -e):

  alignment-faults                                   [Software event]
  bpf-output                                         [Software event]
  context-switches OR cs                             [Software event]
  cpu-clock                                          [Software event]
  cpu-migrations OR migrations                       [Software event]
  dummy                                              [Software event]
  emulation-faults                                   [Software event]
  major-faults                                       [Software event]
  minor-faults                                       [Software event]
  page-faults OR faults                              [Software event]
  task-clock                                         [Software event]
[...]
These are also documented in the man page perf_event_open(2):
[...]
                   PERF_COUNT_SW_CPU_CLOCK
                          This reports the CPU clock, a  high-resolution  per-
                          CPU timer.

                   PERF_COUNT_SW_TASK_CLOCK
                          This reports a clock count specific to the task that
                          is running.

                   PERF_COUNT_SW_PAGE_FAULTS
                          This reports the number of page faults.

                   PERF_COUNT_SW_CONTEXT_SWITCHES
                          This counts context switches.  Until  Linux  2.6.34,
                          these  were all reported as user-space events, after
                          that they are reported as happening in the kernel.

                   PERF_COUNT_SW_CPU_MIGRATIONS
                          This reports the number of  times  the  process  has
                          migrated to a new CPU.

                   PERF_COUNT_SW_PAGE_FAULTS_MIN
                          This  counts the number of minor page faults.  These
                          did not require disk I/O to handle.
[...]
The kernel also supports traecpoints, which are very similar to software events, but have a different more extensible API.
Software events may have a default period. This means that when you use them for sampling, you're sampling a subset of events, not tracing every event. You can check with perf record -vv:
# perf record -vv -e context-switches /bin/true
Using CPUID GenuineIntel-6-55
------------------------------------------------------------
perf_event_attr:
  type                             1
  size                             112
  config                           0x3
  { sample_period, sample_freq }   4000
  sample_type                      IP|TID|TIME|PERIOD
  disabled                         1
  inherit                          1
  mmap                             1
  comm                             1
  freq                             1
  enable_on_exec                   1
[...]
See the perf_event_open(2) man page for a description of these fields. This default means is that the kernel adjusts the rate of sampling so that it's capturing about 4,000 context switch events per second. If you really meant to record them all, use -c 1:
# perf record -vv -e context-switches -c 1 /bin/true
Using CPUID GenuineIntel-6-55
------------------------------------------------------------
perf_event_attr:
  type                             1
  size                             112
  config                           0x3
  { sample_period, sample_freq }   1
  sample_type                      IP|TID|TIME
  disabled                         1
  inherit                          1
  mmap                             1
  comm                             1
  enable_on_exec                   1
Check the rate of events using perf stat first, so that you can estimate the volume of data you'll be capturing. Sampling a subset by default may be a good thing, especially for high frequency events like context switches.
Many other events (like tracepoints) have a default of 1 anyway. You'll encounter a non-1 default for many software and hardware events.
5.2. Hardware Events (PMCs)
perf_events began life as a tool for instrumenting the processor's performance monitoring unit (PMU) hardware counters, also called performance monitoring counters (PMCs), or performance instrumentation counters (PICs). These instrument low-level processor activity, for example, CPU cycles, instructions retired, memory stall cycles, level 2 cache misses, etc. Some will be listed as Hardware Cache Events.
PMCs are documented in the Intel 64 and IA-32 Architectures Software Developer's Manual Volume 3B: System Programming Guide, Part 2 and the BIOS and Kernel Developer's Guide (BKDG) For AMD Family 10h Processors. There are thousands of different PMCs available.
A typical processor will implement PMCs in the following way: only a few or several can be recorded at the same time, from the many thousands that are available. This is because they are a fixed hardware resource on the processor (a limited number of registers), and are programmed to begin counting the selected events.
For examples of using PMCs, see CPU Statistics.
5.3. Kernel Tracepoints
These tracepoints are hard coded in interesting and logical locations of the kernel, so that higher-level behavior can be easily traced. For example, system calls, TCP events, file system I/O, disk I/O, etc. These are grouped into libraries of tracepoints; eg, "sock:" for socket events, "sched:" for CPU scheduler events. A key value of tracepoints is that they should have a stable API, so if you write tools that use them on one kernel version, they should work on later versions as well.
Tracepoints are usually added to kernel code by placing a macro from include/trace/events/*. XXX cover implementation.
Summarizing the tracepoint library names and numbers of tracepoints, on my Linux 4.10 system:
# perf list | awk -F: '/Tracepoint event/ { lib[$1]++ } END {
    for (l in lib) { printf "  %-16.16s %d\n", l, lib[l] } }' | sort | column
    alarmtimer     4	    i2c            8	    page_isolation 1	    swiotlb        1
    block          19	    iommu          7	    pagemap        2	    syscalls       614
    btrfs          51	    irq            5	    power          22	    task           2
    cgroup         9	    irq_vectors    22	    printk         1	    thermal        7
    clk            14	    jbd2           16	    random         15	    thermal_power_ 2
    cma            2	    kmem           12	    ras            4	    timer          13
    compaction     14	    libata         6	    raw_syscalls   2	    tlb            1
    cpuhp          3	    mce            1	    rcu            1	    udp            1
    dma_fence      8	    mdio           1	    regmap         15	    vmscan         15
    exceptions     2	    migrate        2	    regulator      7	    vsyscall       1
    ext4           95	    mmc            2	    rpm            4	    workqueue      4
    fib            3	    module         5	    sched          24	    writeback      30
    fib6           1	    mpx            5	    scsi           5	    x86_fpu        14
    filelock       10	    msr            3	    sdt_node       1	    xen            35
    filemap        2	    napi           1	    signal         2	    xfs            495
    ftrace         1	    net            10	    skb            3	    xhci-hcd       9
    gpio           2	    nmi            1	    sock           2
    huge_memory    4	    oom            1	    spi            7
These include:
- block: block device I/O
- ext4: file system operations
- kmem: kernel memory allocation events
- random: kernel random number generator events
- sched: CPU scheduler events
- syscalls: system call enter and exits
- task: task events
It's worth checking the list of tracepoints after every kernel upgrade, to see if any are new. The value of adding them has been debated from time to time, with it wondered how many people will use them (I do). There is a balance to aim for: I'd include the smallest number of probes that sufficiently covers common needs, and anything unusual or uncommon can be left to dynamic tracing.
For examples of using tracepoints, see Static Kernel Tracing.
5.4. User-Level Statically Defined Tracing (USDT)
Similar to kernel tracepoints, these are hardcoded (usually by placing macros) in the application source at logical and interesting locations, and presented (event name and arguments) as a stable API. Many applications already include tracepoints, added to support DTrace. However, many of these applications do not compile them in by default on Linux. Often you need to compile the application yourself using a --with-dtrace flag.
For example, compiling USDT events with this version of Node.js:
$ sudo apt-get install systemtap-sdt-dev       # adds "dtrace", used by node build
$ wget https://nodejs.org/dist/v4.4.1/node-v4.4.1.tar.gz
$ tar xvf node-v4.4.1.tar.gz
$ cd node-v4.4.1
$ ./configure --with-dtrace
$ make -j 8
To check that the resulting node binary has probes included:
$ readelf -n node

Displaying notes found at file offset 0x00000254 with length 0x00000020:
  Owner                 Data size	Description
  GNU                  0x00000010	NT_GNU_ABI_TAG (ABI version tag)
    OS: Linux, ABI: 2.6.32

Displaying notes found at file offset 0x00000274 with length 0x00000024:
  Owner                 Data size	Description
  GNU                  0x00000014	NT_GNU_BUILD_ID (unique build ID bitstring)
    Build ID: 1e01659b0aecedadf297b2c56c4a2b536ae2308a

Displaying notes found at file offset 0x00e70994 with length 0x000003c4:
  Owner                 Data size	Description
  stapsdt              0x0000003c	NT_STAPSDT (SystemTap probe descriptors)
    Provider: node
    Name: gc__start
    Location: 0x0000000000dc14e4, Base: 0x000000000112e064, Semaphore: 0x000000000147095c
    Arguments: 4@%esi 4@%edx 8@%rdi
  stapsdt              0x0000003b	NT_STAPSDT (SystemTap probe descriptors)
    Provider: node
    Name: gc__done
    Location: 0x0000000000dc14f4, Base: 0x000000000112e064, Semaphore: 0x000000000147095e
    Arguments: 4@%esi 4@%edx 8@%rdi
  stapsdt              0x00000067	NT_STAPSDT (SystemTap probe descriptors)
    Provider: node
    Name: http__server__response
    Location: 0x0000000000dc1894, Base: 0x000000000112e064, Semaphore: 0x0000000001470956
    Arguments: 8@%rax 8@-1144(%rbp) -4@-1148(%rbp) -4@-1152(%rbp)
  stapsdt              0x00000061	NT_STAPSDT (SystemTap probe descriptors)
    Provider: node
    Name: net__stream__end
    Location: 0x0000000000dc1c44, Base: 0x000000000112e064, Semaphore: 0x0000000001470952
    Arguments: 8@%rax 8@-1144(%rbp) -4@-1148(%rbp) -4@-1152(%rbp)
  stapsdt              0x00000068	NT_STAPSDT (SystemTap probe descriptors)
    Provider: node
    Name: net__server__connection
    Location: 0x0000000000dc1ff4, Base: 0x000000000112e064, Semaphore: 0x0000000001470950
    Arguments: 8@%rax 8@-1144(%rbp) -4@-1148(%rbp) -4@-1152(%rbp)
  stapsdt              0x00000060	NT_STAPSDT (SystemTap probe descriptors)
    Provider: node
    Name: http__client__response
    Location: 0x0000000000dc23c5, Base: 0x000000000112e064, Semaphore: 0x000000000147095a
    Arguments: 8@%rdx 8@-1144(%rbp) -4@%eax -4@-1152(%rbp)
  stapsdt              0x00000089	NT_STAPSDT (SystemTap probe descriptors)
    Provider: node
    Name: http__client__request
    Location: 0x0000000000dc285e, Base: 0x000000000112e064, Semaphore: 0x0000000001470958
    Arguments: 8@%rax 8@%rdx 8@-2184(%rbp) -4@-2188(%rbp) 8@-2232(%rbp) 8@-2240(%rbp) -4@-2192(%rbp)
  stapsdt              0x00000089	NT_STAPSDT (SystemTap probe descriptors)
    Provider: node
    Name: http__server__request
    Location: 0x0000000000dc2e69, Base: 0x000000000112e064, Semaphore: 0x0000000001470954
    Arguments: 8@%r14 8@%rax 8@-4344(%rbp) -4@-4348(%rbp) 8@-4304(%rbp) 8@-4312(%rbp) -4@-4352(%rbp)
For examples of using USDT events, see Static User Tracing.
5.5. Dynamic Tracing
The difference between tracepoints and dynamic tracing is shown in the following figure, which illustrates the coverage of common tracepoint libraries:
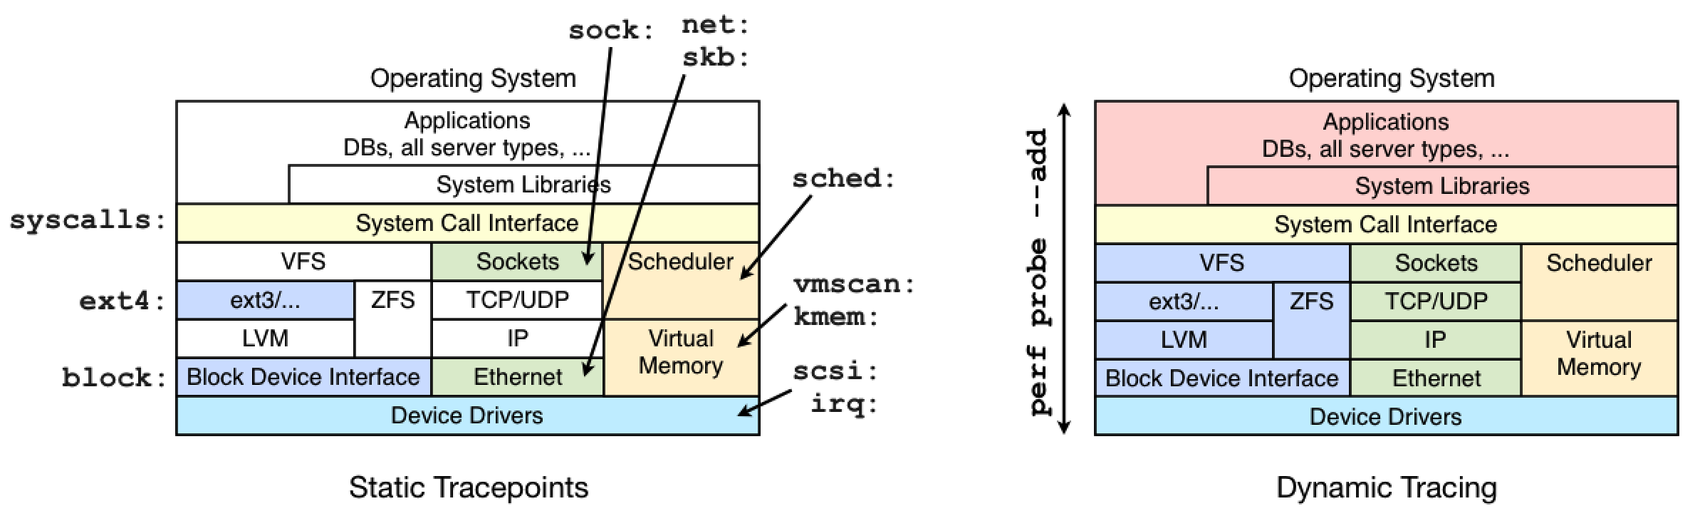
While dynamic tracing can see everything, it's also an unstable interface since it is instrumenting raw code. That means that any dynamic tracing tools you develop may break after a kernel patch or update. Try to use the static tracepoints first, since their interface should be much more stable. They can also be easier to use and understand, since they have been designed with a tracing end-user in mind.
One benefit of dynamic tracing is that it can be enabled on a live system without restarting anything. You can take an already-running kernel or application and then begin dynamic instrumentation, which (safely) patches instructions in memory to add instrumentation. That means there is zero overhead or tax for this feature until you begin using it. One moment your binary is running unmodified and at full speed, and the next, it's running some extra instrumentation instructions that you dynamically added. Those instructions should eventually be removed once you've finished using your session of dynamic tracing.
The overhead while dynamic tracing is in use, and extra instructions are being executed, is relative to the frequency of instrumented events multiplied by the work done on each instrumentation.
For examples of using dynamic tracing, see 6.5. Dynamic Tracing.
6. Examples
These are some examples of perf_events, collected from a variety of 3.x Linux systems.
6.1. CPU Statistics
The perf stat command instruments and summarizes key CPU counters (PMCs). This is from perf version 3.5.7.2:
# perf stat gzip file1

 Performance counter stats for 'gzip file1':

       1920.159821 task-clock                #    0.991 CPUs utilized
                13 context-switches          #    0.007 K/sec
                 0 CPU-migrations            #    0.000 K/sec
               258 page-faults               #    0.134 K/sec
     5,649,595,479 cycles                    #    2.942 GHz                     [83.43%]
     1,808,339,931 stalled-cycles-frontend   #   32.01% frontend cycles idle    [83.54%]
     1,171,884,577 stalled-cycles-backend    #   20.74% backend  cycles idle    [66.77%]
     8,625,207,199 instructions              #    1.53  insns per cycle
                                             #    0.21  stalled cycles per insn [83.51%]
     1,488,797,176 branches                  #  775.351 M/sec                   [82.58%]
        53,395,139 branch-misses             #    3.59% of all branches         [83.78%]

       1.936842598 seconds time elapsed
This includes instructions per cycle (IPC), labled "insns per cycle", or in earlier versions, "IPC". This is a commonly examined metric, either IPC or its invert, CPI. Higher IPC values mean higher instruction throughput, and lower values indicate more stall cycles. I'd generally interpret high IPC values (eg, over 1.0) as good, indicating optimal processing of work. However, I'd want to double check what the instructions are, in case this is due to a spin loop: a high rate of instructions, but a low rate of actual work completed.
There are some advanced metrics now included in perf stat: frontend cycles idle, backend cycles idle, and stalled cycles per insn. To really understand these, you'll need some knowledge of CPU microarchitecture.
CPU Microarchitecture
The frontend and backend metrics refer to the CPU pipeline, and are also based on stall counts. The frontend processes CPU instructions, in order. It involves instruction fetch, along with branch prediction, and decode. The decoded instructions become micro-operations (uops) which the backend processes, and it may do so out of order. For a longer summary of these components, see Shannon Cepeda's great posts on frontend and backend.
The backend can also process multiple uops in parallel; for modern processors, three or four. Along with pipelining, this is how IPC can become greater than one, as more than one instruction can be completed ("retired") per CPU cycle.
Stalled cycles per instruction is similar to IPC (inverted), however, only counting stalled cycles, which will be for memory or resource bus access. This makes it easy to interpret: stalls are latency, reduce stalls. I really like it as a metric, and hope it becomes as commonplace as IPC/CPI. Lets call it SCPI.
Detailed Mode
There is a "detailed" mode for perf stat:
# perf stat -d gzip file1

 Performance counter stats for 'gzip file1':

       1610.719530 task-clock                #    0.998 CPUs utilized
                20 context-switches          #    0.012 K/sec
                 0 CPU-migrations            #    0.000 K/sec
               258 page-faults               #    0.160 K/sec
     5,491,605,997 cycles                    #    3.409 GHz                     [40.18%]
     1,654,551,151 stalled-cycles-frontend   #   30.13% frontend cycles idle    [40.80%]
     1,025,280,350 stalled-cycles-backend    #   18.67% backend  cycles idle    [40.34%]
     8,644,643,951 instructions              #    1.57  insns per cycle
                                             #    0.19  stalled cycles per insn [50.89%]
     1,492,911,665 branches                  #  926.860 M/sec                   [50.69%]
        53,471,580 branch-misses             #    3.58% of all branches         [51.21%]
     1,938,889,736 L1-dcache-loads           # 1203.741 M/sec                   [49.68%]
       154,380,395 L1-dcache-load-misses     #    7.96% of all L1-dcache hits   [49.66%]
                 0 LLC-loads                 #    0.000 K/sec                   [39.27%]
                 0 LLC-load-misses           #    0.00% of all LL-cache hits    [39.61%]

       1.614165346 seconds time elapsed
This includes additional counters for Level 1 data cache events, and last level cache (LLC) events.
Specific Counters
Hardware cache event counters, seen in perf list, can be instrumented. Eg:
# perf list | grep L1-dcache
  L1-dcache-loads                                    [Hardware cache event]
  L1-dcache-load-misses                              [Hardware cache event]
  L1-dcache-stores                                   [Hardware cache event]
  L1-dcache-store-misses                             [Hardware cache event]
  L1-dcache-prefetches                               [Hardware cache event]
  L1-dcache-prefetch-misses                          [Hardware cache event]
# perf stat -e L1-dcache-loads,L1-dcache-load-misses,L1-dcache-stores gzip file1

 Performance counter stats for 'gzip file1':

     1,947,551,657 L1-dcache-loads

       153,829,652 L1-dcache-misses
         #    7.90% of all L1-dcache hits
     1,171,475,286 L1-dcache-stores


       1.538038091 seconds time elapsed
The percentage printed is a convenient calculation that perf_events has included, based on the counters I specified. If you include the "cycles" and "instructions" counters, it will include an IPC calculation in the output.
These hardware events that can be measured are often specific to the processor model. Many may not be available from within a virtualized environment.
Raw Counters
The Intel 64 and IA-32 Architectures Software Developer's Manual Volume 3B: System Programming Guide, Part 2 and the BIOS and Kernel Developer's Guide (BKDG) For AMD Family 10h Processors are full of interesting counters, but most cannot be found in perf list. If you find one you want to instrument, you can specify it as a raw event with the format: rUUEE, where UU == umask, and EE == event number. Here's an example where I've added a couple of raw counters:
# perf stat -e cycles,instructions,r80a2,r2b1 gzip file1

 Performance counter stats for 'gzip file1':

     5,586,963,328 cycles                    #    0.000 GHz
     8,608,237,932 instructions              #    1.54  insns per cycle
         9,448,159 raw 0x80a2
    11,855,777,803 raw 0x2b1

       1.588618969 seconds time elapsed
If I did this right, then r80a2 has instrumented RESOURCE_STALLS.OTHER, and r2b1 has instrumented UOPS_DISPATCHED.CORE: the number of uops dispatched each cycle. It's easy to mess this up, and you'll want to double check that you are on the right page of the manual for your processor.
If you do find an awesome raw counter, please suggest it be added as an alias in perf_events, so we all can find it in perf list.
Other Options
The perf subcommands, especially perf stat, have an extensive option set which can be listed using "-h". I've included the full output for perf stat here from version 3.9.3, not as a reference, but as an illustration of the interface:
# perf stat -h

 usage: perf stat [<options>] [<command>]

    -e, --event <event>   event selector. use 'perf list' to list available events
        --filter <filter>
                          event filter
    -i, --no-inherit      child tasks do not inherit counters
    -p, --pid <pid>       stat events on existing process id
    -t, --tid <tid>       stat events on existing thread id
    -a, --all-cpus        system-wide collection from all CPUs
    -g, --group           put the counters into a counter group
    -c, --scale           scale/normalize counters
    -v, --verbose         be more verbose (show counter open errors, etc)
    -r, --repeat <n>      repeat command and print average + stddev (max: 100)
    -n, --null            null run - dont start any counters
    -d, --detailed        detailed run - start a lot of events
    -S, --sync            call sync() before starting a run
    -B, --big-num         print large numbers with thousands' separators
    -C, --cpu <cpu>       list of cpus to monitor in system-wide
    -A, --no-aggr         disable CPU count aggregation
    -x, --field-separator <separator>
                          print counts with custom separator
    -G, --cgroup <name>   monitor event in cgroup name only
    -o, --output <file>   output file name
        --append          append to the output file
        --log-fd <n>      log output to fd, instead of stderr
        --pre <command>   command to run prior to the measured command
        --post <command>  command to run after to the measured command
    -I, --interval-print <n>
                          print counts at regular interval in ms (>= 100)
        --aggr-socket     aggregate counts per processor socket
Options such as --repeat, --sync, --pre, and --post can be quite useful when doing automated testing or micro-benchmarking.
6.2. Timed Profiling
perf_events can profile CPU usage based on sampling the instruction pointer or stack trace at a fixed interval (timed profiling).
Sampling CPU stacks at 99 Hertz (-F 99), for the entire system (-a, for all CPUs), with stack traces (-g, for call graphs), for 10 seconds:
# perf record -F 99 -a -g -- sleep 30
[ perf record: Woken up 9 times to write data ]
[ perf record: Captured and wrote 3.135 MB perf.data (~136971 samples) ]
# ls -lh perf.data
-rw------- 1 root root 3.2M Jan 26 07:26 perf.data
The choice of 99 Hertz, instead of 100 Hertz, is to avoid accidentally sampling in lockstep with some periodic activity, which would produce skewed results. This is also coarse: you may want to increase that to higher rates (eg, up to 997 Hertz) for finer resolution, especially if you are sampling short bursts of activity and you'd still like enough resolution to be useful. Bear in mind that higher frequencies means higher overhead.
The perf.data file can be processed in a variety of ways. On recent versions, the perf report command launches an ncurses navigator for call graph inspection. Older versions of perf (or if you use --stdio in the new version) print the call graph as a tree, annotated with percentages:
# perf report --stdio
# ========
# captured on: Mon Jan 26 07:26:40 2014
# hostname : dev2
# os release : 3.8.6-ubuntu-12-opt
# perf version : 3.8.6
# arch : x86_64
# nrcpus online : 8
# nrcpus avail : 8
# cpudesc : Intel(R) Xeon(R) CPU X5675 @ 3.07GHz
# cpuid : GenuineIntel,6,44,2
# total memory : 8182008 kB
# cmdline : /usr/bin/perf record -F 99 -a -g -- sleep 30
# event : name = cpu-clock, type = 1, config = 0x0, config1 = 0x0, config2 = ...
# HEADER_CPU_TOPOLOGY info available, use -I to display
# HEADER_NUMA_TOPOLOGY info available, use -I to display
# pmu mappings: software = 1, breakpoint = 5
# ========
#
# Samples: 22K of event 'cpu-clock'
# Event count (approx.): 22751
#
# Overhead  Command      Shared Object                           Symbol
# ........  .......  .................  ...............................
#
    94.12%       dd  [kernel.kallsyms]  [k] _raw_spin_unlock_irqrestore
                 |
                 --- _raw_spin_unlock_irqrestore
                    |
                    |--96.67%-- extract_buf
                    |          extract_entropy_user
                    |          urandom_read
                    |          vfs_read
                    |          sys_read
                    |          system_call_fastpath
                    |          read
                    |
                    |--1.69%-- account
                    |          |
                    |          |--99.72%-- extract_entropy_user
                    |          |          urandom_read
                    |          |          vfs_read
                    |          |          sys_read
                    |          |          system_call_fastpath
                    |          |          read
                    |           --0.28%-- [...]
                    |
                    |--1.60%-- mix_pool_bytes.constprop.17
[...]
This tree starts with the on-CPU functions and works back through the ancestry. This approach is called a "callee based call graph". This can be flipped by using -G for an "inverted call graph", or by using the "caller" option to -g/--call-graph, instead of the "callee" default.
The hottest (most frequent) stack trace in this perf call graph occurred in 90.99% of samples, which is the product of the overhead percentage and top stack leaf (94.12% x 96.67%, which are relative rates). perf report can also be run with "-g graph" to show absolute overhead rates, in which case "90.99%" is directly displayed on the stack leaf:
    94.12%       dd  [kernel.kallsyms]  [k] _raw_spin_unlock_irqrestore
                 |
                 --- _raw_spin_unlock_irqrestore
                    |
                    |--90.99%-- extract_buf
[...]
If user-level stacks look incomplete, you can try perf record with "--call-graph dwarf" as a different technique to unwind them. See the Stacks section.
The output from perf report can be many pages long, which can become cumbersome to read. Try generating Flame Graphs from the same data.
6.3. Event Profiling
Apart from sampling at a timed interval, taking samples triggered by CPU hardware counters is another form of CPU profiling, which can be used to shed more light on cache misses, memory stall cycles, and other low-level processor events. The available events can be found using perf list:
# perf list | grep Hardware
  cpu-cycles OR cycles                               [Hardware event]
  instructions                                       [Hardware event]
  cache-references                                   [Hardware event]
  cache-misses                                       [Hardware event]
  branch-instructions OR branches                    [Hardware event]
  branch-misses                                      [Hardware event]
  bus-cycles                                         [Hardware event]
  stalled-cycles-frontend OR idle-cycles-frontend    [Hardware event]
  stalled-cycles-backend OR idle-cycles-backend      [Hardware event]
  ref-cycles                                         [Hardware event]
  L1-dcache-loads                                    [Hardware cache event]
  L1-dcache-load-misses                              [Hardware cache event]
  L1-dcache-stores                                   [Hardware cache event]
  L1-dcache-store-misses                             [Hardware cache event]
[...]
For many of these, gathering a stack on every occurrence would induce far too much overhead, and would slow down the system and change the performance characteristics of the target. It's usually sufficient to only instrument a small fraction of their occurrences, rather than all of them. This can be done by specifying a threshold for triggering event collection, using "-c" and a count.
For example, the following one-liner instruments Level 1 data cache load misses, collecting a stack trace for one in every 10,000 occurrences:
# perf record -e L1-dcache-load-misses -c 10000 -ag -- sleep 5
The mechanics of "-c count" are implemented by the processor, which only interrupts the kernel when the threshold has been reached.
See the earlier Raw Counters section for an example of specifying a custom counter, and the next section about skew.
Skew and PEBS
There's a problem with event profiling that you don't really encounter with CPU profiling (timed sampling). With timed sampling, it doesn't matter if there was a small sub-microsecond delay between the interrupt and reading the instruction pointer (IP). Some CPU profilers introduce this jitter on purpose, as another way to avoid lockstep sampling. But for event profiling, it does matter: if you're trying to capture the IP on some PMC event, and there's a delay between the PMC overflow and capturing the IP, then the IP will point to the wrong address. This is skew. Another contributing problem is that micro-ops are processed in parallel and out-of-order, while the instruction pointer points to the resumption instruction, not the instruction that caused the event. I've talked about this before.
The solution is "precise sampling", which on Intel is PEBS (Precise Event-Based Sampling), and on AMD it is IBS (Instruction-Based Sampling). These use CPU hardware support to capture the real state of the CPU at the time of the event. perf can use precise sampling by adding a :p modifier to the PMC event name, eg, "-e instructions:p". The more p's, the more accurate. Here are the docs from tools/perf/Documentation/perf-list.txt:
The 'p' modifier can be used for specifying how precise the instruction
address should be. The 'p' modifier can be specified multiple times:

 0 - SAMPLE_IP can have arbitrary skid
 1 - SAMPLE_IP must have constant skid
 2 - SAMPLE_IP requested to have 0 skid
 3 - SAMPLE_IP must have 0 skid
In some cases, perf will default to using precise sampling without you needing to specify it. Run "perf record -vv ..." to see the value of "precise_ip". Also note that only some PMCs support PEBS.
If PEBS isn't working at all for you, check dmesg:
# dmesg | grep -i pebs
[    0.387014] Performance Events: PEBS fmt1+, SandyBridge events, 16-deep LBR, full-width counters, Intel PMU driver.
[    0.387034] core: PEBS disabled due to CPU errata, please upgrade microcode
The fix (on Intel):
# apt-get install -y intel-microcode
[...]
intel-microcode: microcode will be updated at next boot
Processing triggers for initramfs-tools (0.125ubuntu5) ...
update-initramfs: Generating /boot/initrd.img-4.8.0-41-generic
# reboot

(system reboots)

# dmesg | grep -i pebs
[    0.386596] Performance Events: PEBS fmt1+, SandyBridge events, 16-deep LBR, full-width counters, Intel PMU driver.
#
XXX: Need to cover more PEBS problems and other caveats.
6.4. Static Kernel Tracing
The following examples demonstrate static tracing: the instrumentation of tracepoints and other static events.
Counting Syscalls
The following simple one-liner counts system calls for the executed command, and prints a summary (of non-zero counts):
# perf stat -e 'syscalls:sys_enter_*' gzip file1 2>&1 | awk '$1 != 0'

 Performance counter stats for 'gzip file1':

                 1 syscalls:sys_enter_utimensat
                 1 syscalls:sys_enter_unlink
                 5 syscalls:sys_enter_newfstat
             1,603 syscalls:sys_enter_read
             3,201 syscalls:sys_enter_write
                 5 syscalls:sys_enter_access
                 1 syscalls:sys_enter_fchmod
                 1 syscalls:sys_enter_fchown
                 6 syscalls:sys_enter_open
                 9 syscalls:sys_enter_close
                 8 syscalls:sys_enter_mprotect
                 1 syscalls:sys_enter_brk
                 1 syscalls:sys_enter_munmap
                 1 syscalls:sys_enter_set_robust_list
                 1 syscalls:sys_enter_futex
                 1 syscalls:sys_enter_getrlimit
                 5 syscalls:sys_enter_rt_sigprocmask
                14 syscalls:sys_enter_rt_sigaction
                 1 syscalls:sys_enter_exit_group
                 1 syscalls:sys_enter_set_tid_address
                14 syscalls:sys_enter_mmap

       1.543990940 seconds time elapsed
In this case, a gzip command was analyzed. The report shows that there were 3,201 write() syscalls, and half that number of read() syscalls. Many of the other syscalls will be due to process and library initialization.
A similar report can be seen using strace -c, the system call tracer, however it may induce much higher overhead than perf, as perf buffers data in-kernel.
perf vs strace
To explain the difference a little further: the current implementation of strace uses ptrace(2) to attach to the target process and stop it during system calls, like a debugger. This is violent, and can cause serious overhead. To demonstrate this, the following syscall-heavy program was run by itself, with perf, and with strace. I've only included the line of output that shows its performance:
# dd if=/dev/zero of=/dev/null bs=512 count=10000k
5242880000 bytes (5.2 GB) copied, 3.53031 s, 1.5 GB/s

# perf stat -e 'syscalls:sys_enter_*' dd if=/dev/zero of=/dev/null bs=512 count=10000k
5242880000 bytes (5.2 GB) copied, 9.14225 s, 573 MB/s

# strace -c dd if=/dev/zero of=/dev/null bs=512 count=10000k
5242880000 bytes (5.2 GB) copied, 218.915 s, 23.9 MB/s
With perf, the program ran 2.5x slower. But with strace, it ran 62x slower. That's likely to be a worst-case result: if syscalls are not so frequent, the difference between the tools will not be as great.
Recent version of perf have included a trace subcommand, to provide some similar functionality to strace, but with much lower overhead.
New Processes
Tracing new processes triggered by a "man ls":
# perf record -e sched:sched_process_exec -a
^C[ perf record: Woken up 1 times to write data ]
[ perf record: Captured and wrote 0.064 MB perf.data (~2788 samples) ]
# perf report -n --sort comm --stdio
[...]
# Overhead       Samples  Command
# ........  ............  .......
#
    11.11%             1    troff
    11.11%             1      tbl
    11.11%             1  preconv
    11.11%             1    pager
    11.11%             1    nroff
    11.11%             1      man
    11.11%             1   locale
    11.11%             1   grotty
    11.11%             1    groff
Nine different commands were executed, each once. I used -n to print the "Samples" column, and "--sort comm" to customize the remaining columns.
This works by tracing sched:sched_process_exec, when a process runs exec() to execute a different binary. This is often how new processes are created, but not always. An application may fork() to create a pool of worker processes, but not exec() a different binary. An application may also reexec: call exec() again, on itself, usually to clean up its address space. In that case, it's will be seen by this exec tracepoint, but it's not a new process.
The sched:sched_process_fork tracepoint can be traced to only catch new processes, created via fork(). The downside is that the process identified is the parent, not the new target, as the new process has yet to exec() it's final program.
Outbound Connections
There can be times when it's useful to double check what network connections are initiated by a server, from which processes, and why. You might be surprised. These connections can be important to understand, as they can be a source of latency.
For this example, I have a completely idle ubuntu server, and while tracing I'll login to it using ssh. I'm going to trace outbound connections via the connect() syscall. Given that I'm performing an inbound connection over SSH, will there be any outbound connections at all?
# perf record -e syscalls:sys_enter_connect -a
^C[ perf record: Woken up 1 times to write data ]
[ perf record: Captured and wrote 0.057 MB perf.data (~2489 samples) ]
# perf report --stdio
# ========
# captured on: Tue Jan 28 10:53:38 2014
# hostname : ubuntu
# os release : 3.5.0-23-generic
# perf version : 3.5.7.2
# arch : x86_64
# nrcpus online : 2
# nrcpus avail : 2
# cpudesc : Intel(R) Core(TM) i7-3820QM CPU @ 2.70GHz
# cpuid : GenuineIntel,6,58,9
# total memory : 1011932 kB
# cmdline : /usr/bin/perf_3.5.0-23 record -e syscalls:sys_enter_connect -a
# event : name = syscalls:sys_enter_connect, type = 2, config = 0x38b, ...
# HEADER_CPU_TOPOLOGY info available, use -I to display
# HEADER_NUMA_TOPOLOGY info available, use -I to display
# ========
#
# Samples: 21  of event 'syscalls:sys_enter_connect'
# Event count (approx.): 21
#
# Overhead  Command       Shared Object                       Symbol
# ........  .......  ..................  ...........................
#
    52.38%     sshd  libc-2.15.so        [.] __GI___connect_internal
    19.05%   groups  libc-2.15.so        [.] __GI___connect_internal
     9.52%     sshd  libpthread-2.15.so  [.] __connect_internal
     9.52%     mesg  libc-2.15.so        [.] __GI___connect_internal
     9.52%     bash  libc-2.15.so        [.] __GI___connect_internal
The report shows that sshd, groups, mesg, and bash are all performing connect() syscalls. Ring a bell?
The stack traces that led to the connect() can explain why:
# perf record -e syscalls:sys_enter_connect -ag
^C[ perf record: Woken up 1 times to write data ]
[ perf record: Captured and wrote 0.057 MB perf.data (~2499 samples) ]
# perf report --stdio
[...]
    55.00%     sshd  libc-2.15.so        [.] __GI___connect_internal
               |
               --- __GI___connect_internal
                  |
                  |--27.27%-- add_one_listen_addr.isra.0
                  |
                  |--27.27%-- __nscd_get_mapping
                  |          __nscd_get_map_ref
                  |
                  |--27.27%-- __nscd_open_socket
                   --18.18%-- [...]
    20.00%   groups  libc-2.15.so        [.] __GI___connect_internal
             |
             --- __GI___connect_internal
                |
                |--50.00%-- __nscd_get_mapping
                |          __nscd_get_map_ref
                |
                 --50.00%-- __nscd_open_socket
    10.00%     mesg  libc-2.15.so        [.] __GI___connect_internal
               |
               --- __GI___connect_internal
                  |
                  |--50.00%-- __nscd_get_mapping
                  |          __nscd_get_map_ref
                  |
                   --50.00%-- __nscd_open_socket
    10.00%     bash  libc-2.15.so        [.] __GI___connect_internal
               |
               --- __GI___connect_internal
                  |
                  |--50.00%-- __nscd_get_mapping
                  |          __nscd_get_map_ref
                  |
                   --50.00%-- __nscd_open_socket
     5.00%     sshd  libpthread-2.15.so  [.] __connect_internal
               |
               --- __connect_internal
Ah, these are nscd calls: the name service cache daemon. If you see hexadecimal numbers and not function names, you will need to install debug info: see the earlier section on Symbols. These nscd calls are likely triggered by calling getaddrinfo(), which server software may be using to resolve IP addresses for logging, or for matching hostnames in config files. Browsing the stack traces should identify why.
For sshd, this was called via add_one_listen_addr(): a name that was only visible after adding the openssh-server-dbgsym package. Unfortunately, the stack trace doesn't continue after add_one_listen_add(). I can browse the OpenSSH code to figure out the reasons we're calling into add_one_listen_add(), or, I can get the stack traces to work. See the earlier section on Stack Traces.
I took a quick look at the OpenSSH code, and it looks like this code-path is due to parsing ListenAddress from the sshd_config file, which can contain either an IP address or a hostname.
Socket Buffers
Tracing the consumption of socket buffers, and the stack traces, is one way to identify what is leading to socket or network I/O.
# perf record -e 'skb:consume_skb' -ag
^C[ perf record: Woken up 1 times to write data ]
[ perf record: Captured and wrote 0.065 MB perf.data (~2851 samples) ]
# perf report
[...]
    74.42%  swapper  [kernel.kallsyms]  [k] consume_skb
            |
            --- consume_skb
                arp_process
                arp_rcv
                __netif_receive_skb_core
                __netif_receive_skb
                netif_receive_skb
                virtnet_poll
                net_rx_action
                __do_softirq
                irq_exit
                do_IRQ
                ret_from_intr
                default_idle
                cpu_idle
                start_secondary

    25.58%     sshd  [kernel.kallsyms]  [k] consume_skb
               |
               --- consume_skb
                   dev_kfree_skb_any
                   free_old_xmit_skbs.isra.24
                   start_xmit
                   dev_hard_start_xmit
                   sch_direct_xmit
                   dev_queue_xmit
                   ip_finish_output
                   ip_output
                   ip_local_out
                   ip_queue_xmit
                   tcp_transmit_skb
                   tcp_write_xmit
                   __tcp_push_pending_frames
                   tcp_sendmsg
                   inet_sendmsg
                   sock_aio_write
                   do_sync_write
                   vfs_write
                   sys_write
                   system_call_fastpath
                   __write_nocancel
The swapper stack shows the network receive path, triggered by an interrupt. The sshd path shows writes.
6.5. Static User Tracing
Support was added in later 4.x series kernels. The following demonstrates Linux 4.10 (with an additional patchset), and tracing the Node.js USDT probes:
# perf buildid-cache --add `which node`
# perf list | grep sdt_node
  sdt_node:gc__done                                  [SDT event]
  sdt_node:gc__start                                 [SDT event]
  sdt_node:http__client__request                     [SDT event]
  sdt_node:http__client__response                    [SDT event]
  sdt_node:http__server__request                     [SDT event]
  sdt_node:http__server__response                    [SDT event]
  sdt_node:net__server__connection                   [SDT event]
  sdt_node:net__stream__end                          [SDT event]
# perf record -e sdt_node:http__server__request -a
^C[ perf record: Woken up 1 times to write data ]
[ perf record: Captured and wrote 0.446 MB perf.data (3 samples) ]
# perf script
            node  7646 [002]   361.012364: sdt_node:http__server__request: (dc2e69)
            node  7646 [002]   361.204718: sdt_node:http__server__request: (dc2e69)
            node  7646 [002]   361.363043: sdt_node:http__server__request: (dc2e69)
XXX fill me in, including how to use arguments.
If you are on an older kernel, say, Linux 4.4-4.9, you can probably get these to work with adjustments (I've even hacked them up with ftrace for older kernels), but since they have been in development, I haven't seen documentation outside of lkml, so you'll need to figure it out. (On this kernel range, you might find more documentation for tracing these with bcc/eBPF, including using the trace.py tool.)
6.6. Dynamic Tracing
For kernel analysis, I'm using CONFIG_KPROBES=y and CONFIG_KPROBE_EVENTS=y, to enable kernel dynamic tracing, and CONFIG_FRAME_POINTER=y, for frame pointer-based kernel stacks. For user-level analysis, CONFIG_UPROBES=y and CONFIG_UPROBE_EVENTS=y, for user-level dynamic tracing.
Kernel: tcp_sendmsg()
This example shows instrumenting the kernel tcp_sendmsg() function on the Linux 3.9.3 kernel:
# perf probe --add tcp_sendmsg
Failed to find path of kernel module.
Added new event:
  probe:tcp_sendmsg    (on tcp_sendmsg)

You can now use it in all perf tools, such as:

	perf record -e probe:tcp_sendmsg -aR sleep 1
This adds a new tracepoint event. It suggests using the -R option, to collect raw sample records, which is already the default for tracepoints. Tracing this event for 5 seconds, recording stack traces:
# perf record -e probe:tcp_sendmsg -a -g -- sleep 5
[ perf record: Woken up 1 times to write data ]
[ perf record: Captured and wrote 0.228 MB perf.data (~9974 samples) ]
And the report:
# perf report --stdio
# ========
# captured on: Fri Jan 31 20:10:14 2014
# hostname : pgbackup
# os release : 3.9.3-ubuntu-12-opt
# perf version : 3.9.3
# arch : x86_64
# nrcpus online : 8
# nrcpus avail : 8
# cpudesc : Intel(R) Xeon(R) CPU E5-2670 0 @ 2.60GHz
# cpuid : GenuineIntel,6,45,7
# total memory : 8179104 kB
# cmdline : /lib/modules/3.9.3/build/tools/perf/perf record -e probe:tcp_sendmsg -a -g -- sleep 5
# event : name = probe:tcp_sendmsg, type = 2, config = 0x3b2, config1 = 0x0, config2 = 0x0, ...
# HEADER_CPU_TOPOLOGY info available, use -I to display
# HEADER_NUMA_TOPOLOGY info available, use -I to display
# pmu mappings: software = 1, tracepoint = 2, breakpoint = 5
# ========
#
# Samples: 12  of event 'probe:tcp_sendmsg'
# Event count (approx.): 12
#
# Overhead  Command      Shared Object           Symbol
# ........  .......  .................  ...............
#
   100.00%     sshd  [kernel.kallsyms]  [k] tcp_sendmsg
               |
               --- tcp_sendmsg
                   sock_aio_write
                   do_sync_write
                   vfs_write
                   sys_write
                   system_call_fastpath
                   __write_nocancel
                  |
                  |--8.33%-- 0x50f00000001b810
                   --91.67%-- [...]
This shows the path from the write() system call to tcp_sendmsg().
You can delete these dynamic tracepoints if you want after use, using perf probe --del.
Kernel: tcp_sendmsg() with size
If your kernel has debuginfo (CONFIG_DEBUG_INFO=y), you can fish out kernel variables from functions. This is a simple example of examining a size_t (integer), on Linux 3.13.1.
Listing variables available for tcp_sendmsg():
# perf probe -V tcp_sendmsg
Available variables at tcp_sendmsg
        @<tcp_sendmsg+0>
                size_t  size
                struct kiocb*   iocb
                struct msghdr*  msg
                struct sock*    sk
Creating a probe for tcp_sendmsg() with the "size" variable:
# perf probe --add 'tcp_sendmsg size'
Added new event:
  probe:tcp_sendmsg    (on tcp_sendmsg with size)

You can now use it in all perf tools, such as:

	perf record -e probe:tcp_sendmsg -aR sleep 1
Tracing this probe:
# perf record -e probe:tcp_sendmsg -a
^C[ perf record: Woken up 1 times to write data ]
[ perf record: Captured and wrote 0.052 MB perf.data (~2252 samples) ]
# perf script
# ========
# captured on: Fri Jan 31 23:49:55 2014
# hostname : dev1
# os release : 3.13.1-ubuntu-12-opt
# perf version : 3.13.1
# arch : x86_64
# nrcpus online : 2
# nrcpus avail : 2
# cpudesc : Intel(R) Xeon(R) CPU E5645 @ 2.40GHz
# cpuid : GenuineIntel,6,44,2
# total memory : 1796024 kB
# cmdline : /usr/bin/perf record -e probe:tcp_sendmsg -a
# event : name = probe:tcp_sendmsg, type = 2, config = 0x1dd, config1 = 0x0, config2 = ...
# HEADER_CPU_TOPOLOGY info available, use -I to display
# HEADER_NUMA_TOPOLOGY info available, use -I to display
# pmu mappings: software = 1, tracepoint = 2, breakpoint = 5
# ========
#
            sshd  1301 [001]   502.424719: probe:tcp_sendmsg: (ffffffff81505d80) size=b0
            sshd  1301 [001]   502.424814: probe:tcp_sendmsg: (ffffffff81505d80) size=40
            sshd  2371 [000]   502.952590: probe:tcp_sendmsg: (ffffffff81505d80) size=27
            sshd  2372 [000]   503.025023: probe:tcp_sendmsg: (ffffffff81505d80) size=3c0
            sshd  2372 [001]   503.203776: probe:tcp_sendmsg: (ffffffff81505d80) size=98
            sshd  2372 [001]   503.281312: probe:tcp_sendmsg: (ffffffff81505d80) size=2d0
            sshd  2372 [001]   503.461358: probe:tcp_sendmsg: (ffffffff81505d80) size=30
            sshd  2372 [001]   503.670239: probe:tcp_sendmsg: (ffffffff81505d80) size=40
            sshd  2372 [001]   503.742565: probe:tcp_sendmsg: (ffffffff81505d80) size=140
            sshd  2372 [001]   503.822005: probe:tcp_sendmsg: (ffffffff81505d80) size=20
            sshd  2371 [000]   504.118728: probe:tcp_sendmsg: (ffffffff81505d80) size=30
            sshd  2371 [000]   504.192575: probe:tcp_sendmsg: (ffffffff81505d80) size=70
[...]
The size is shown as hexadecimal.
Kernel: tcp_sendmsg() line number and local variable
With debuginfo, perf_events can create tracepoints for lines within kernel functions. Listing available line probes for tcp_sendmsg():
# perf probe -L tcp_sendmsg
<tcp_sendmsg@/mnt/src/linux-3.14.5/net/ipv4/tcp.c:0>
      0  int tcp_sendmsg(struct kiocb *iocb, struct sock *sk, struct msghdr *msg,
                        size_t size)
      2  {
                struct iovec *iov;
                struct tcp_sock *tp = tcp_sk(sk);
                struct sk_buff *skb;
      6         int iovlen, flags, err, copied = 0;
      7         int mss_now = 0, size_goal, copied_syn = 0, offset = 0;
                bool sg;
                long timeo;
[...]
     79                 while (seglen > 0) {
                                int copy = 0;
     81                         int max = size_goal;

                                skb = tcp_write_queue_tail(sk);
     84                         if (tcp_send_head(sk)) {
     85                                 if (skb->ip_summed == CHECKSUM_NONE)
                                                max = mss_now;
     87                                 copy = max - skb->len;
                                }

     90                         if (copy <= 0) {
         new_segment:
[...]
This is Linux 3.14.5; your kernel version may look different. Lets check what variables are available on line 81:
# perf probe -V tcp_sendmsg:81
Available variables at tcp_sendmsg:81
        @<tcp_sendmsg+537>
                bool    sg
                int     copied
                int     copied_syn
                int     flags
                int     mss_now
                int     offset
                int     size_goal
                long int        timeo
                size_t  seglen
                struct iovec*   iov
                struct sock*    sk
                unsigned char*  from
Now lets trace line 81, with the seglen variable that is checked in the loop:
# perf probe --add 'tcp_sendmsg:81 seglen'
Added new event:
  probe:tcp_sendmsg    (on tcp_sendmsg:81 with seglen)

You can now use it in all perf tools, such as:

	perf record -e probe:tcp_sendmsg -aR sleep 1

# perf record -e probe:tcp_sendmsg -a
^C[ perf record: Woken up 1 times to write data ]
[ perf record: Captured and wrote 0.188 MB perf.data (~8200 samples) ]
# perf script
            sshd  4652 [001] 2082360.931086: probe:tcp_sendmsg: (ffffffff81642ca9) seglen=0x80
   app_plugin.pl  2400 [001] 2082360.970489: probe:tcp_sendmsg: (ffffffff81642ca9) seglen=0x20
        postgres  2422 [000] 2082360.970703: probe:tcp_sendmsg: (ffffffff81642ca9) seglen=0x52
   app_plugin.pl  2400 [000] 2082360.970890: probe:tcp_sendmsg: (ffffffff81642ca9) seglen=0x7b
        postgres  2422 [001] 2082360.971099: probe:tcp_sendmsg: (ffffffff81642ca9) seglen=0xb
   app_plugin.pl  2400 [000] 2082360.971140: probe:tcp_sendmsg: (ffffffff81642ca9) seglen=0x55
[...]
This is pretty amazing. Remember that you can also include in-kernel filtering using --filter, to match only the data you want.
User: malloc()
While this is an interesting example, I want to say right off the bat that malloc() calls are very frequent, so you will need to consider the overheads of tracing calls like this.
Adding a libc malloc() probe:
# perf probe -x /lib/x86_64-linux-gnu/libc-2.15.so --add malloc
Added new event:
  probe_libc:malloc    (on 0x82f20)

You can now use it in all perf tools, such as:

	perf record -e probe_libc:malloc -aR sleep 1
Tracing it system-wide:
# perf record -e probe_libc:malloc -a
^C[ perf record: Woken up 12 times to write data ]
[ perf record: Captured and wrote 3.522 MB perf.data (~153866 samples) ]
The report:
# perf report -n
[...]
# Samples: 45K of event 'probe_libc:malloc'
# Event count (approx.): 45158
#
# Overhead       Samples          Command  Shared Object      Symbol
# ........  ............  ...............  .............  ..........
#
    42.72%         19292       apt-config  libc-2.15.so   [.] malloc
    19.71%          8902             grep  libc-2.15.so   [.] malloc
     7.88%          3557             sshd  libc-2.15.so   [.] malloc
     6.25%          2824              sed  libc-2.15.so   [.] malloc
     6.06%          2738            which  libc-2.15.so   [.] malloc
     4.12%          1862  update-motd-upd  libc-2.15.so   [.] malloc
     3.72%          1680             stat  libc-2.15.so   [.] malloc
     1.68%           758            login  libc-2.15.so   [.] malloc
     1.21%           546        run-parts  libc-2.15.so   [.] malloc
     1.21%           545               ls  libc-2.15.so   [.] malloc
     0.80%           360        dircolors  libc-2.15.so   [.] malloc
     0.56%           252               tr  libc-2.15.so   [.] malloc
     0.54%           242              top  libc-2.15.so   [.] malloc
     0.49%           222       irqbalance  libc-2.15.so   [.] malloc
     0.44%           200             dpkg  libc-2.15.so   [.] malloc
     0.38%           173         lesspipe  libc-2.15.so   [.] malloc
     0.29%           130  update-motd-fsc  libc-2.15.so   [.] malloc
     0.25%           112            uname  libc-2.15.so   [.] malloc
     0.24%           108              cut  libc-2.15.so   [.] malloc
     0.23%           104           groups  libc-2.15.so   [.] malloc
     0.21%            94  release-upgrade  libc-2.15.so   [.] malloc
     0.18%            82        00-header  libc-2.15.so   [.] malloc
     0.14%            62             mesg  libc-2.15.so   [.] malloc
     0.09%            42  update-motd-reb  libc-2.15.so   [.] malloc
     0.09%            40             date  libc-2.15.so   [.] malloc
     0.08%            35             bash  libc-2.15.so   [.] malloc
     0.08%            35         basename  libc-2.15.so   [.] malloc
     0.08%            34          dirname  libc-2.15.so   [.] malloc
     0.06%            29               sh  libc-2.15.so   [.] malloc
     0.06%            26        99-footer  libc-2.15.so   [.] malloc
     0.05%            24              cat  libc-2.15.so   [.] malloc
     0.04%            18             expr  libc-2.15.so   [.] malloc
     0.04%            17         rsyslogd  libc-2.15.so   [.] malloc
     0.03%            12             stty  libc-2.15.so   [.] malloc
     0.00%             1             cron  libc-2.15.so   [.] malloc
This shows the most malloc() calls were by apt-config, while I was tracing.
User: malloc() with size
As of the Linux 3.13.1 kernel, this is not supported yet:
# perf probe -x /lib/x86_64-linux-gnu/libc-2.15.so --add 'malloc size'
Debuginfo-analysis is not yet supported with -x/--exec option.
  Error: Failed to add events. (-38)
As a workaround, you can access the registers (on Linux 3.7+). For example, on x86_64:
# perf probe -x /lib64/libc-2.17.so '--add=malloc size=%di'
       probe_libc:malloc    (on 0x800c0 with size=%di)
These registers ("%di" etc) are dependent on your processor architecture. To figure out which ones to use, see the X86 calling conventions on Wikipedia, or page 24 of the AMD64 ABI (PDF). (Thanks Jose E. Nunez for digging out these references.)
6.7. Scheduler Analysis
The perf sched subcommand provides a number of tools for analyzing kernel CPU scheduler behavior. You can use this to identify and quantify issues of scheduler latency.
The current overhead of this tool (as of up to Linux 4.10) may be noticeable, as it instruments and dumps scheduler events to the perf.data file for later analysis. For example:
# perf sched record -- sleep 1
[ perf record: Woken up 1 times to write data ]
[ perf record: Captured and wrote 1.886 MB perf.data (13502 samples) ]
That's 1.9 Mbytes for one second, including 13,502 samples. The size and rate will be relative to your workload and number of CPUs (this example is an 8 CPU server running a software build). How this is written to the file system has been optimized: it only woke up one time to read the event buffers and write them to disk, which greatly reduces overhead. That said, there are still significant overheads with instrumenting all scheduler events and writing event data to the file system. These events:
# perf script --header
# ========
# captured on: Sun Feb 26 19:40:00 2017
# hostname : bgregg-xenial
# os release : 4.10-virtual
# perf version : 4.10
# arch : x86_64
# nrcpus online : 8
# nrcpus avail : 8
# cpudesc : Intel(R) Xeon(R) CPU E5-2680 v2 @ 2.80GHz
# cpuid : GenuineIntel,6,62,4
# total memory : 15401700 kB
# cmdline : /usr/bin/perf sched record -- sleep 1
# event : name = sched:sched_switch, , id = { 2752, 2753, 2754, 2755, 2756, 2757, 2758, 2759 }, type = 2, size = 11...
# event : name = sched:sched_stat_wait, , id = { 2760, 2761, 2762, 2763, 2764, 2765, 2766, 2767 }, type = 2, size =...
# event : name = sched:sched_stat_sleep, , id = { 2768, 2769, 2770, 2771, 2772, 2773, 2774, 2775 }, type = 2, size ...
# event : name = sched:sched_stat_iowait, , id = { 2776, 2777, 2778, 2779, 2780, 2781, 2782, 2783 }, type = 2, size...
# event : name = sched:sched_stat_runtime, , id = { 2784, 2785, 2786, 2787, 2788, 2789, 2790, 2791 }, type = 2, siz...
# event : name = sched:sched_process_fork, , id = { 2792, 2793, 2794, 2795, 2796, 2797, 2798, 2799 }, type = 2, siz...
# event : name = sched:sched_wakeup, , id = { 2800, 2801, 2802, 2803, 2804, 2805, 2806, 2807 }, type = 2, size = 11...
# event : name = sched:sched_wakeup_new, , id = { 2808, 2809, 2810, 2811, 2812, 2813, 2814, 2815 }, type = 2, size ...
# event : name = sched:sched_migrate_task, , id = { 2816, 2817, 2818, 2819, 2820, 2821, 2822, 2823 }, type = 2, siz...
# HEADER_CPU_TOPOLOGY info available, use -I to display
# HEADER_NUMA_TOPOLOGY info available, use -I to display
# pmu mappings: breakpoint = 5, power = 7, software = 1, tracepoint = 2, msr = 6
# HEADER_CACHE info available, use -I to display
# missing features: HEADER_BRANCH_STACK HEADER_GROUP_DESC HEADER_AUXTRACE HEADER_STAT
# ========
#
    perf 16984 [005] 991962.879966:       sched:sched_wakeup: comm=perf pid=16999 prio=120 target_cpu=005
[...]
If overhead is a problem, you can use my eBPF/bcc Tools including runqlat and runqlen which use in-kernel summaries of scheduler events, reducing overhead further. An advantage of perf sched dumping all events is that you aren't limited to the summary. If you caught an intermittent event, you can analyze those recorded events in custom ways until you understood the issue, rather than needing to catch it a second time.
The captured trace file can be reported in a number of ways, summarized by the help message:
# perf sched -h

 Usage: perf sched [] {record|latency|map|replay|script|timehist}

    -D, --dump-raw-trace  dump raw trace in ASCII
    -f, --force           don't complain, do it
    -i, --input     input file name
    -v, --verbose         be more verbose (show symbol address, etc)
perf sched latency will summarize scheduler latencies by task, including average and maximum delay:
# perf sched latency

 -----------------------------------------------------------------------------------------------------------------
  Task                  |   Runtime ms  | Switches | Average delay ms | Maximum delay ms | Maximum delay at       |
 -----------------------------------------------------------------------------------------------------------------
  cat:(6)               |     12.002 ms |        6 | avg:   17.541 ms | max:   29.702 ms | max at: 991962.948070 s
  ar:17043              |      3.191 ms |        1 | avg:   13.638 ms | max:   13.638 ms | max at: 991963.048070 s
  rm:(10)               |     20.955 ms |       10 | avg:   11.212 ms | max:   19.598 ms | max at: 991963.404069 s
  objdump:(6)           |     35.870 ms |        8 | avg:   10.969 ms | max:   16.509 ms | max at: 991963.424443 s
  :17008:17008          |    462.213 ms |       50 | avg:   10.464 ms | max:   35.999 ms | max at: 991963.120069 s
  grep:(7)              |     21.655 ms |       11 | avg:    9.465 ms | max:   24.502 ms | max at: 991963.464082 s
  fixdep:(6)            |     81.066 ms |        8 | avg:    9.023 ms | max:   19.521 ms | max at: 991963.120068 s
  mv:(10)               |     30.249 ms |       14 | avg:    8.380 ms | max:   21.688 ms | max at: 991963.200073 s
  ld:(3)                |     14.353 ms |        6 | avg:    7.376 ms | max:   15.498 ms | max at: 991963.452070 s
  recordmcount:(7)      |     14.629 ms |        9 | avg:    7.155 ms | max:   18.964 ms | max at: 991963.292100 s
  svstat:17067          |      1.862 ms |        1 | avg:    6.142 ms | max:    6.142 ms | max at: 991963.280069 s
  cc1:(21)              |   6013.457 ms |     1138 | avg:    5.305 ms | max:   44.001 ms | max at: 991963.436070 s
  gcc:(18)              |     43.596 ms |       40 | avg:    3.905 ms | max:   26.994 ms | max at: 991963.380069 s
  ps:17073              |     27.158 ms |        4 | avg:    3.751 ms | max:    8.000 ms | max at: 991963.332070 s
[...]
To shed some light as to how this is instrumented and calculated, I'll show the events that led to the top event's "Maximum delay at" of 29.702 ms. Here are the raw events from perf sched script:
      sh 17028 [001] 991962.918368:   sched:sched_wakeup_new: comm=sh pid=17030 prio=120 target_cpu=002
[...]
     cc1 16819 [002] 991962.948070:       sched:sched_switch: prev_comm=cc1 prev_pid=16819 prev_prio=120
                                                            prev_state=R ==> next_comm=sh next_pid=17030 next_prio=120
[...]
The time from the wakeup (991962.918368, which is in seconds) to the context switch (991962.948070) is 29.702 ms. This process is listed as "sh" (shell) in the raw events, but execs "cat" soon after, so is shown as "cat" in the perf sched latency output.
perf sched map shows all CPUs and context-switch events, with columns representing what each CPU was doing and when. It's the kind of data you see visualized in scheduler analysis GUIs (including perf timechart, with the layout rotated 90 degrees). Example output:
# perf sched map
                      *A0           991962.879971 secs A0 => perf:16999
                       A0     *B0   991962.880070 secs B0 => cc1:16863
          *C0          A0      B0   991962.880070 secs C0 => :17023:17023
  *D0      C0          A0      B0   991962.880078 secs D0 => ksoftirqd/0:6
   D0      C0 *E0      A0      B0   991962.880081 secs E0 => ksoftirqd/3:28
   D0      C0 *F0      A0      B0   991962.880093 secs F0 => :17022:17022
  *G0      C0  F0      A0      B0   991962.880108 secs G0 => :17016:17016
   G0      C0  F0     *H0      B0   991962.880256 secs H0 => migration/5:39
   G0      C0  F0     *I0      B0   991962.880276 secs I0 => perf:16984
   G0      C0  F0     *J0      B0   991962.880687 secs J0 => cc1:16996
   G0      C0 *K0      J0      B0   991962.881839 secs K0 => cc1:16945
   G0      C0  K0      J0 *L0  B0   991962.881841 secs L0 => :17020:17020
   G0      C0  K0      J0 *M0  B0   991962.882289 secs M0 => make:16637
   G0      C0  K0      J0 *N0  B0   991962.883102 secs N0 => make:16545
   G0     *O0  K0      J0  N0  B0   991962.883880 secs O0 => cc1:16819
   G0 *A0  O0  K0      J0  N0  B0   991962.884069 secs
   G0  A0  O0  K0 *P0  J0  N0  B0   991962.884076 secs P0 => rcu_sched:7
   G0  A0  O0  K0 *Q0  J0  N0  B0   991962.884084 secs Q0 => cc1:16831
   G0  A0  O0  K0  Q0  J0 *R0  B0   991962.884843 secs R0 => cc1:16825
   G0 *S0  O0  K0  Q0  J0  R0  B0   991962.885636 secs S0 => cc1:16900
   G0  S0  O0 *T0  Q0  J0  R0  B0   991962.886893 secs T0 => :17014:17014
   G0  S0  O0 *K0  Q0  J0  R0  B0   991962.886917 secs
[...]
This is an 8 CPU system, and you can see the 8 columns for each CPU starting from the left. Some CPU columns begin blank, as we've yet to trace an event on that CPU at the start of the profile. They quickly become populated.
The two character codes you see ("A0", "C0") are identifiers for tasks, which are mapped on the right ("=>"). This is more compact than using process (task) IDs. The "*" shows which CPU had the context switch event, and the new event that was running. For example, the very last line shows that at 991962.886917 (seconds) CPU 4 context-switched to K0 (a "cc1" process, PID 16945).
That example was from a busy system. Here's an idle system:
# perf sched map
                      *A0           993552.887633 secs A0 => perf:26596
  *.                   A0           993552.887781 secs .  => swapper:0
   .                  *B0           993552.887843 secs B0 => migration/5:39
   .                  *.            993552.887858 secs
   .                   .  *A0       993552.887861 secs
   .                  *C0  A0       993552.887903 secs C0 => bash:26622
   .                  *.   A0       993552.888020 secs
   .          *D0      .   A0       993552.888074 secs D0 => rcu_sched:7
   .          *.       .   A0       993552.888082 secs
   .           .      *C0  A0       993552.888143 secs
   .      *.   .       C0  A0       993552.888173 secs
   .       .   .      *B0  A0       993552.888439 secs
   .       .   .      *.   A0       993552.888454 secs
   .      *C0  .       .   A0       993552.888457 secs
   .       C0  .       .  *.        993552.889257 secs
   .      *.   .       .   .        993552.889764 secs
   .       .  *E0      .   .        993552.889767 secs E0 => bash:7902
[...]
Idle CPUs are shown as ".".
Remember to examine the timestamp column to make sense of this visualization (GUIs use that as a dimension, which is easier to comprehend, but here the numbers are just listed). It's also only showing context switch events, and not scheduler latency. The newer timehist command has a visualization (-V) that can include wakeup events.
perf sched timehist was added in Linux 4.10, and shows the scheduler latency by event, including the time the task was waiting to be woken up (wait time) and the scheduler latency after wakeup to running (sch delay). It's the scheduler latency that we're more interested in tuning. Example output:
# perf sched timehist
Samples do not have callchains.
           time    cpu  task name                       wait time  sch delay   run time
                        [tid/pid]                          (msec)     (msec)     (msec)
--------------- ------  ------------------------------  ---------  ---------  ---------
  991962.879971 [0005]  perf[16984]                         0.000      0.000      0.000
  991962.880070 [0007]  :17008[17008]                       0.000      0.000      0.000
  991962.880070 [0002]  cc1[16880]                          0.000      0.000      0.000
  991962.880078 [0000]  cc1[16881]                          0.000      0.000      0.000
  991962.880081 [0003]  cc1[16945]                          0.000      0.000      0.000
  991962.880093 [0003]  ksoftirqd/3[28]                     0.000      0.007      0.012
  991962.880108 [0000]  ksoftirqd/0[6]                      0.000      0.007      0.030
  991962.880256 [0005]  perf[16999]                         0.000      0.005      0.285
  991962.880276 [0005]  migration/5[39]                     0.000      0.007      0.019
  991962.880687 [0005]  perf[16984]                         0.304      0.000      0.411
  991962.881839 [0003]  cat[17022]                          0.000      0.000      1.746
  991962.881841 [0006]  cc1[16825]                          0.000      0.000      0.000
[...]
  991963.885740 [0001]  :17008[17008]                      25.613      0.000      0.057
  991963.886009 [0001]  sleep[16999]                     1000.104      0.006      0.269
  991963.886018 [0005]  cc1[17083]                         19.998      0.000      9.948
This output includes the sleep command run to set the duration of perf itself to one second. Note that sleep's wait time is 1000.104 milliseconds because I had run "sleep 1": that's the time it was asleep waiting its timer wakeup event. Its scheduler latency was only 0.006 milliseconds, and its time on-CPU was 0.269 milliseconds.
There are a number of options to timehist, including -V to add a CPU visualization column, -M to add migration events, and -w for wakeup events. For example:
# perf sched timehist -MVw
Samples do not have callchains.
           time    cpu  012345678  task name           wait time  sch delay   run time
                                   [tid/pid]              (msec)     (msec)     (msec)
--------------- ------  ---------  ------------------  ---------  ---------  ---------
  991962.879966 [0005]             perf[16984]                                          awakened: perf[16999]
  991962.879971 [0005]       s     perf[16984]             0.000      0.000      0.000
  991962.880070 [0007]         s   :17008[17008]           0.000      0.000      0.000
  991962.880070 [0002]    s        cc1[16880]              0.000      0.000      0.000
  991962.880071 [0000]             cc1[16881]                                           awakened: ksoftirqd/0[6]
  991962.880073 [0003]             cc1[16945]                                           awakened: ksoftirqd/3[28]
  991962.880078 [0000]  s          cc1[16881]              0.000      0.000      0.000
  991962.880081 [0003]     s       cc1[16945]              0.000      0.000      0.000
  991962.880093 [0003]     s       ksoftirqd/3[28]         0.000      0.007      0.012
  991962.880108 [0000]  s          ksoftirqd/0[6]          0.000      0.007      0.030
  991962.880249 [0005]             perf[16999]                                          awakened: migration/5[39]
  991962.880256 [0005]       s     perf[16999]             0.000      0.005      0.285
  991962.880264 [0005]        m      migration/5[39]                                      migrated: perf[16999] cpu 5 => 1
  991962.880276 [0005]       s     migration/5[39]         0.000      0.007      0.019
  991962.880682 [0005]        m      perf[16984]                                          migrated: cc1[16996] cpu 0 => 5
  991962.880687 [0005]       s     perf[16984]             0.304      0.000      0.411
  991962.881834 [0003]             cat[17022]                                           awakened: :17020
[...]
  991963.885734 [0001]             :17008[17008]                                        awakened: sleep[16999]
  991963.885740 [0001]   s         :17008[17008]          25.613      0.000      0.057
  991963.886005 [0001]             sleep[16999]                                         awakened: perf[16984]
  991963.886009 [0001]   s         sleep[16999]         1000.104      0.006      0.269
  991963.886018 [0005]       s     cc1[17083]             19.998      0.000      9.948
The CPU visualization column ("012345678") has "s" for context-switch events, and "m" for migration events, showing the CPU of the event. If you run perf sched record -g, then the stack traces are appended on the right in a single line (not shown here).
The last events in that output include those related to the "sleep 1" command used to time perf. The wakeup happened at 991963.885734, and at 991963.885740 (6 microseconds later) CPU 1 begins to context-switch to the sleep process. The column for that event still shows ":17008[17008]" for what was on-CPU, but the target of the context switch (sleep) is not shown. It is in the raw events:
  :17008 17008 [001] 991963.885740:       sched:sched_switch: prev_comm=cc1 prev_pid=17008 prev_prio=120
                                                             prev_state=R ==> next_comm=sleep next_pid=16999 next_prio=120
The 991963.886005 event shows that the perf command received a wakeup while sleep was running (almost certainly sleep waking up its parent process because it terminated), and then we have the context switch on 991963.886009 where sleep stops running, and a summary is printed out: 1000.104 ms waiting (the "sleep 1"), with 0.006 ms scheduler latency, and 0.269 ms of CPU runtime.
Here I've decorated the timehist output with the details of the context switch destination in red:
  991963.885734 [0001]             :17008[17008]                                        awakened: sleep[16999]
  991963.885740 [0001]   s         :17008[17008]          25.613      0.000      0.057  next: sleep[16999]
  991963.886005 [0001]             sleep[16999]                                         awakened: perf[16984]
  991963.886009 [0001]   s         sleep[16999]         1000.104      0.006      0.269  next: cc1[17008]
  991963.886018 [0005]       s     cc1[17083]             19.998      0.000      9.948  next: perf[16984]
When sleep finished, a waiting "cc1" process then executed. perf ran on the following context switch, and is the last event in the profile (perf terminated). I've added this as a -n/--next option to perf (should arrive in Linux 4.11 or 4.12).
perf sched script dumps all events (similar to perf script):
# perf sched script

    perf 16984 [005] 991962.879960: sched:sched_stat_runtime: comm=perf pid=16984 runtime=3901506 [ns] vruntime=165...
    perf 16984 [005] 991962.879966:       sched:sched_wakeup: comm=perf pid=16999 prio=120 target_cpu=005
    perf 16984 [005] 991962.879971:       sched:sched_switch: prev_comm=perf prev_pid=16984 prev_prio=120 prev_stat...
    perf 16999 [005] 991962.880058: sched:sched_stat_runtime: comm=perf pid=16999 runtime=98309 [ns] vruntime=16405...
     cc1 16881 [000] 991962.880058: sched:sched_stat_runtime: comm=cc1 pid=16881 runtime=3999231 [ns] vruntime=7897...
  :17024 17024 [004] 991962.880058: sched:sched_stat_runtime: comm=cc1 pid=17024 runtime=3866637 [ns] vruntime=7810...
     cc1 16900 [001] 991962.880058: sched:sched_stat_runtime: comm=cc1 pid=16900 runtime=3006028 [ns] vruntime=7772...
     cc1 16825 [006] 991962.880058: sched:sched_stat_runtime: comm=cc1 pid=16825 runtime=3999423 [ns] vruntime=7876...
Each of these events ("sched:sched_stat_runtime" etc) are tracepoints you can instrument directly using perf record.
As I've shown earlier, this raw output can be useful for digging further than the summary commands.
perf sched replay will take the recorded scheduler events, and then simulate the workload by spawning threads with similar runtimes and context switches. Useful for testing and developing scheduler changes and configuration. Don't put too much faith in this (and other) workload replayers: they can be a useful load generator, but it's difficult to simulate the real workload completely. Here I'm running replay with -r -1, to repeat the workload:
# perf sched replay -r -1
run measurement overhead: 84 nsecs
sleep measurement overhead: 146710 nsecs
the run test took 1000005 nsecs
the sleep test took 1107773 nsecs
nr_run_events:        4175
nr_sleep_events:      4710
nr_wakeup_events:     2138
task      0 (             swapper:         0), nr_events: 13
task      1 (             swapper:         1), nr_events: 1
task      2 (             swapper:         2), nr_events: 1
task      3 (            kthreadd:         4), nr_events: 1
task      4 (            kthreadd:         6), nr_events: 29
[...]
task    530 (                  sh:     17145), nr_events: 4
task    531 (                  sh:     17146), nr_events: 7
task    532 (                  sh:     17147), nr_events: 4
task    533 (                make:     17148), nr_events: 10
task    534 (                  sh:     17149), nr_events: 1
------------------------------------------------------------
#1  : 965.996, ravg: 966.00, cpu: 798.24 / 798.24
#2  : 902.647, ravg: 966.00, cpu: 1157.53 / 798.24
#3  : 945.482, ravg: 966.00, cpu: 925.25 / 798.24
#4  : 943.541, ravg: 966.00, cpu: 761.72 / 798.24
#5  : 914.643, ravg: 966.00, cpu: 1604.32 / 798.24
[...]
6.8. eBPF
As of Linux 4.4, perf has some enhanced BPF support (aka eBPF or just "BPF"), with more in later kernels. BPF makes perf tracing programmatic, and takes perf from being a counting & sampling-with-post-processing tracer, to a fully in-kernel programmable tracer.
eBPF is currently a little restricted and difficult to use from perf. It's getting better all the time. A different and currently easier way to access eBPF is via the bcc Python interface, which is described on my eBPF Tools page. On this page, I'll discuss perf.
Prerequisites
Linux 4.4 at least. Newer versions have more perf/BPF features, so the newer the better. Also clang (eg, apt-get install clang).
kmem_cache_alloc from Example
This program traces the kernel kmem_cache_alloc() function, only if its calling function matches a specified range, filtered in kernel context. You can imagine doing this for efficiency: instead of tracing all allocations, which can be very frequent and add significant overhead, you filter for just a range of kernel calling functions of interest, such as a kernel module. I'll loosely match tcp functions as an example, which are in memory at these addresses:
# grep tcp /proc/kallsyms | more
[...]
ffffffff817c1bb0 t tcp_get_info_chrono_stats
ffffffff817c1c60 T tcp_init_sock
ffffffff817c1e30 t tcp_splice_data_recv
ffffffff817c1e70 t tcp_push
ffffffff817c20a0 t tcp_send_mss
ffffffff817c2170 t tcp_recv_skb
ffffffff817c2250 t tcp_cleanup_rbuf
[...]
ffffffff818524f0 T tcp6_proc_exit
ffffffff81852510 T tcpv6_exit
ffffffff818648a0 t tcp6_gro_complete
ffffffff81864910 t tcp6_gro_receive
ffffffff81864ae0 t tcp6_gso_segment
ffffffff8187bd89 t tcp_v4_inbound_md5_hash
I'll assume these functions are contiguous, so that by tracing the range 0xffffffff817c1bb0 to 0xffffffff8187bd89, I'm matching much of tcp.
Here is my BPF program, kca_from.c:
#include <uapi/linux/bpf.h>
#include <uapi/linux/ptrace.h>

#define SEC(NAME) __attribute__((section(NAME), used))

/*
 * Edit the following to match the instruction address range you want to
 * sample. Eg, look in /proc/kallsyms. The addresses will change for each
 * kernel version and build.
 */
#define RANGE_START  0xffffffff817c1bb0
#define RANGE_END    0xffffffff8187bd89

struct bpf_map_def {
	unsigned int type;
	unsigned int key_size;
	unsigned int value_size;
	unsigned int max_entries;
};

static int (*probe_read)(void *dst, int size, void *src) =
    (void *)BPF_FUNC_probe_read;
static int (*get_smp_processor_id)(void) =
    (void *)BPF_FUNC_get_smp_processor_id;
static int (*perf_event_output)(void *, struct bpf_map_def *, int, void *,
    unsigned long) = (void *)BPF_FUNC_perf_event_output;

struct bpf_map_def SEC("maps") channel = {
	.type = BPF_MAP_TYPE_PERF_EVENT_ARRAY,
	.key_size = sizeof(int),
	.value_size = sizeof(u32),
	.max_entries = __NR_CPUS__,
};

SEC("func=kmem_cache_alloc")
int func(struct pt_regs *ctx)
{
	u64 ret = 0;
	// x86_64 specific:
	probe_read(&ret, sizeof(ret), (void *)(ctx->bp+8));
	if (ret >= RANGE_START && ret < RANGE_END) {
		perf_event_output(ctx, &channel, get_smp_processor_id(),
		    &ret, sizeof(ret));
	}
	return 0;
}

char _license[] SEC("license") = "GPL";
int _version SEC("version") = LINUX_VERSION_CODE;
Now I'll execute it, then dump the events:
# perf record -e bpf-output/no-inherit,name=evt/ -e ./kca_from.c/map:channel.event=evt/ -a -- sleep 1
bpf: builtin compilation failed: -95, try external compiler
[ perf record: Woken up 1 times to write data ]
[ perf record: Captured and wrote 0.214 MB perf.data (3 samples) ]

# perf script
 testserver00001 14337 [003] 481432.395181:          0     evt:  ffffffff81210f51 kmem_cache_alloc (/lib/modules/...)
      BPF output: 0000: 0f b4 7c 81 ff ff ff ff  ..|.....
                  0008: 00 00 00 00              ....

    redis-server  1871 [005] 481432.395258:          0     evt:  ffffffff81210f51 kmem_cache_alloc (/lib/modules/...)
      BPF output: 0000: 14 55 7c 81 ff ff ff ff  .U|.....
                  0008: 00 00 00 00              ....

    redis-server  1871 [005] 481432.395456:          0     evt:  ffffffff81210f51 kmem_cache_alloc (/lib/modules/...)
      BPF output: 0000: fe dc 7d 81 ff ff ff ff  ..}.....
                  0008: 00 00 00 00              ....
It worked: the "BPF output" records contain addresses in our range: 0xffffffff817cb40f, and so on. kmem_cache_alloc() is a frequently called function, so that it only matched a few entries in one second of tracing is an indication it is working (I can also relax that range to confirm it).
Adding stack traces with -g:
# perf record -e bpf-output/no-inherit,name=evt/ -e ./kca_from.c/map:channel.event=evt/ -a -g -- sleep 1
bpf: builtin compilation failed: -95, try external compiler
[ perf record: Woken up 1 times to write data ]
[ perf record: Captured and wrote 0.215 MB perf.data (3 samples) ]

# perf script
testserver00001 16744 [002] 481518.262579:          0                 evt:
                  410f51 kmem_cache_alloc (/lib/modules/4.10.0-rc8-virtual/build/vmlinux)
                  9cb40f tcp_conn_request (/lib/modules/4.10.0-rc8-virtual/build/vmlinux)
                  9da243 tcp_v4_conn_request (/lib/modules/4.10.0-rc8-virtual/build/vmlinux)
                  9d0936 tcp_rcv_state_process (/lib/modules/4.10.0-rc8-virtual/build/vmlinux)
                  9db102 tcp_v4_do_rcv (/lib/modules/4.10.0-rc8-virtual/build/vmlinux)
                  9dcabf tcp_v4_rcv (/lib/modules/4.10.0-rc8-virtual/build/vmlinux)
                  9b4af4 ip_local_deliver_finish (/lib/modules/4.10.0-rc8-virtual/build/vmlinux)
                  9b4dff ip_local_deliver (/lib/modules/4.10.0-rc8-virtual/build/vmlinux)
                  9b477b ip_rcv_finish (/lib/modules/4.10.0-rc8-virtual/build/vmlinux)
                  9b50fb ip_rcv (/lib/modules/4.10.0-rc8-virtual/build/vmlinux)
                  97119e __netif_receive_skb_core (/lib/modules/4.10.0-rc8-virtual/build/vmlinux)
                  971708 __netif_receive_skb (/lib/modules/4.10.0-rc8-virtual/build/vmlinux)
                  9725df process_backlog (/lib/modules/4.10.0-rc8-virtual/build/vmlinux)
                  971c8e net_rx_action (/lib/modules/4.10.0-rc8-virtual/build/vmlinux)
                  a8e58d __do_softirq (/lib/modules/4.10.0-rc8-virtual/build/vmlinux)
                  a8c9ac do_softirq_own_stack (/lib/modules/4.10.0-rc8-virtual/build/vmlinux)
                  28a061 do_softirq.part.18 (/lib/modules/4.10.0-rc8-virtual/build/vmlinux)
                  28a0ed __local_bh_enable_ip (/lib/modules/4.10.0-rc8-virtual/build/vmlinux)
                  9b8ff3 ip_finish_output2 (/lib/modules/4.10.0-rc8-virtual/build/vmlinux)
                  9b9f43 ip_finish_output (/lib/modules/4.10.0-rc8-virtual/build/vmlinux)
                  9ba9f6 ip_output (/lib/modules/4.10.0-rc8-virtual/build/vmlinux)
                  9ba155 ip_local_out (/lib/modules/4.10.0-rc8-virtual/build/vmlinux)
                  9ba48a ip_queue_xmit (/lib/modules/4.10.0-rc8-virtual/build/vmlinux)
                  9d3823 tcp_transmit_skb (/lib/modules/4.10.0-rc8-virtual/build/vmlinux)
                  9d5345 tcp_connect (/lib/modules/4.10.0-rc8-virtual/build/vmlinux)
                  9da764 tcp_v4_connect (/lib/modules/4.10.0-rc8-virtual/build/vmlinux)
                  9f1abc __inet_stream_connect (/lib/modules/4.10.0-rc8-virtual/build/vmlinux)
                  9f1d38 inet_stream_connect (/lib/modules/4.10.0-rc8-virtual/build/vmlinux)
                  952fd9 SYSC_connect (/lib/modules/4.10.0-rc8-virtual/build/vmlinux)
                  953c1e sys_connect (/lib/modules/4.10.0-rc8-virtual/build/vmlinux)
                  a8b9fb entry_SYSCALL_64_fastpath (/lib/modules/4.10.0-rc8-virtual/build/vmlinux)
                   10800 __GI___libc_connect (/lib/x86_64-linux-gnu/libpthread-2.23.so)

      BPF output: 0000: 0f b4 7c 81 ff ff ff ff  ..|.....
                  0008: 00 00 00 00              ....

redis-server  1871 [003] 481518.262670:          0                 evt:
                  410f51 kmem_cache_alloc (/lib/modules/4.10.0-rc8-virtual/build/vmlinux)
                  9c5514 tcp_poll (/lib/modules/4.10.0-rc8-virtual/build/vmlinux)
                  9515ba sock_poll (/lib/modules/4.10.0-rc8-virtual/build/vmlinux)
                  485699 sys_epoll_ctl (/lib/modules/4.10.0-rc8-virtual/build/vmlinux)
                  a8b9fb entry_SYSCALL_64_fastpath (/lib/modules/4.10.0-rc8-virtual/build/vmlinux)
                  106dca epoll_ctl (/lib/x86_64-linux-gnu/libc-2.23.so)

      BPF output: 0000: 14 55 7c 81 ff ff ff ff  .U|.....
                  0008: 00 00 00 00              ....

redis-server  1871 [003] 481518.262870:          0                 evt:
                  410f51 kmem_cache_alloc (/lib/modules/4.10.0-rc8-virtual/build/vmlinux)
                  9ddcfe tcp_time_wait (/lib/modules/4.10.0-rc8-virtual/build/vmlinux)
                  9cefff tcp_fin (/lib/modules/4.10.0-rc8-virtual/build/vmlinux)
                  9cf630 tcp_data_queue (/lib/modules/4.10.0-rc8-virtual/build/vmlinux)
                  9d0abd tcp_rcv_state_process (/lib/modules/4.10.0-rc8-virtual/build/vmlinux)
                  9db102 tcp_v4_do_rcv (/lib/modules/4.10.0-rc8-virtual/build/vmlinux)
                  9dca8b tcp_v4_rcv (/lib/modules/4.10.0-rc8-virtual/build/vmlinux)
                  9b4af4 ip_local_deliver_finish (/lib/modules/4.10.0-rc8-virtual/build/vmlinux)
                  9b4dff ip_local_deliver (/lib/modules/4.10.0-rc8-virtual/build/vmlinux)
                  9b477b ip_rcv_finish (/lib/modules/4.10.0-rc8-virtual/build/vmlinux)
                  9b50fb ip_rcv (/lib/modules/4.10.0-rc8-virtual/build/vmlinux)
                  97119e __netif_receive_skb_core (/lib/modules/4.10.0-rc8-virtual/build/vmlinux)
                  971708 __netif_receive_skb (/lib/modules/4.10.0-rc8-virtual/build/vmlinux)
                  9725df process_backlog (/lib/modules/4.10.0-rc8-virtual/build/vmlinux)
                  971c8e net_rx_action (/lib/modules/4.10.0-rc8-virtual/build/vmlinux)
                  a8e58d __do_softirq (/lib/modules/4.10.0-rc8-virtual/build/vmlinux)
                  a8c9ac do_softirq_own_stack (/lib/modules/4.10.0-rc8-virtual/build/vmlinux)
                  28a061 do_softirq.part.18 (/lib/modules/4.10.0-rc8-virtual/build/vmlinux)
                  28a0ed __local_bh_enable_ip (/lib/modules/4.10.0-rc8-virtual/build/vmlinux)
                  9b8ff3 ip_finish_output2 (/lib/modules/4.10.0-rc8-virtual/build/vmlinux)
                  9b9f43 ip_finish_output (/lib/modules/4.10.0-rc8-virtual/build/vmlinux)
                  9ba9f6 ip_output (/lib/modules/4.10.0-rc8-virtual/build/vmlinux)
                  9ba155 ip_local_out (/lib/modules/4.10.0-rc8-virtual/build/vmlinux)
                  9ba48a ip_queue_xmit (/lib/modules/4.10.0-rc8-virtual/build/vmlinux)
                  9d3823 tcp_transmit_skb (/lib/modules/4.10.0-rc8-virtual/build/vmlinux)
                  9d3e24 tcp_write_xmit (/lib/modules/4.10.0-rc8-virtual/build/vmlinux)
                  9d4c31 __tcp_push_pending_frames (/lib/modules/4.10.0-rc8-virtual/build/vmlinux)
                  9d6881 tcp_send_fin (/lib/modules/4.10.0-rc8-virtual/build/vmlinux)
                  9c70b7 tcp_close (/lib/modules/4.10.0-rc8-virtual/build/vmlinux)
                  9f161c inet_release (/lib/modules/4.10.0-rc8-virtual/build/vmlinux)
                  95181f sock_release (/lib/modules/4.10.0-rc8-virtual/build/vmlinux)
                  951892 sock_close (/lib/modules/4.10.0-rc8-virtual/build/vmlinux)
                  43b2f7 __fput (/lib/modules/4.10.0-rc8-virtual/build/vmlinux)
                  43b46e ____fput (/lib/modules/4.10.0-rc8-virtual/build/vmlinux)
                  2a3cfe task_work_run (/lib/modules/4.10.0-rc8-virtual/build/vmlinux)
                  2032ba exit_to_usermode_loop (/lib/modules/4.10.0-rc8-virtual/build/vmlinux)
                  203b29 syscall_return_slowpath (/lib/modules/4.10.0-rc8-virtual/build/vmlinux)
                  a8ba88 entry_SYSCALL_64_fastpath (/lib/modules/4.10.0-rc8-virtual/build/vmlinux)
                   105cd __GI___libc_close (/lib/x86_64-linux-gnu/libpthread-2.23.so)

      BPF output: 0000: fe dc 7d 81 ff ff ff ff  ..}.....
                  0008: 00 00 00 00              ....
This confirms the parent functions that were matched by the range.
More Examples
XXX fill me in.
7. Visualizations
perf_events has a builtin visualization: timecharts, as well as text-style visualization via its text user interface (TUI) and tree reports. The following two sections show visualizations of my own: flame graphs and heat maps. The software I'm using is open source and on github, and produces these from perf_events collected data.
7.1. Flame Graphs
Flame Graphs can be produced from perf_events profiling data using the FlameGraph tools software. This visualizes the same data you see in perf report, and works with any perf.data file that was captured with stack traces (-g).
Example
This example CPU flame graph shows a network workload for the 3.2.9-1 Linux kernel, running as a KVM instance (SVG, PNG):
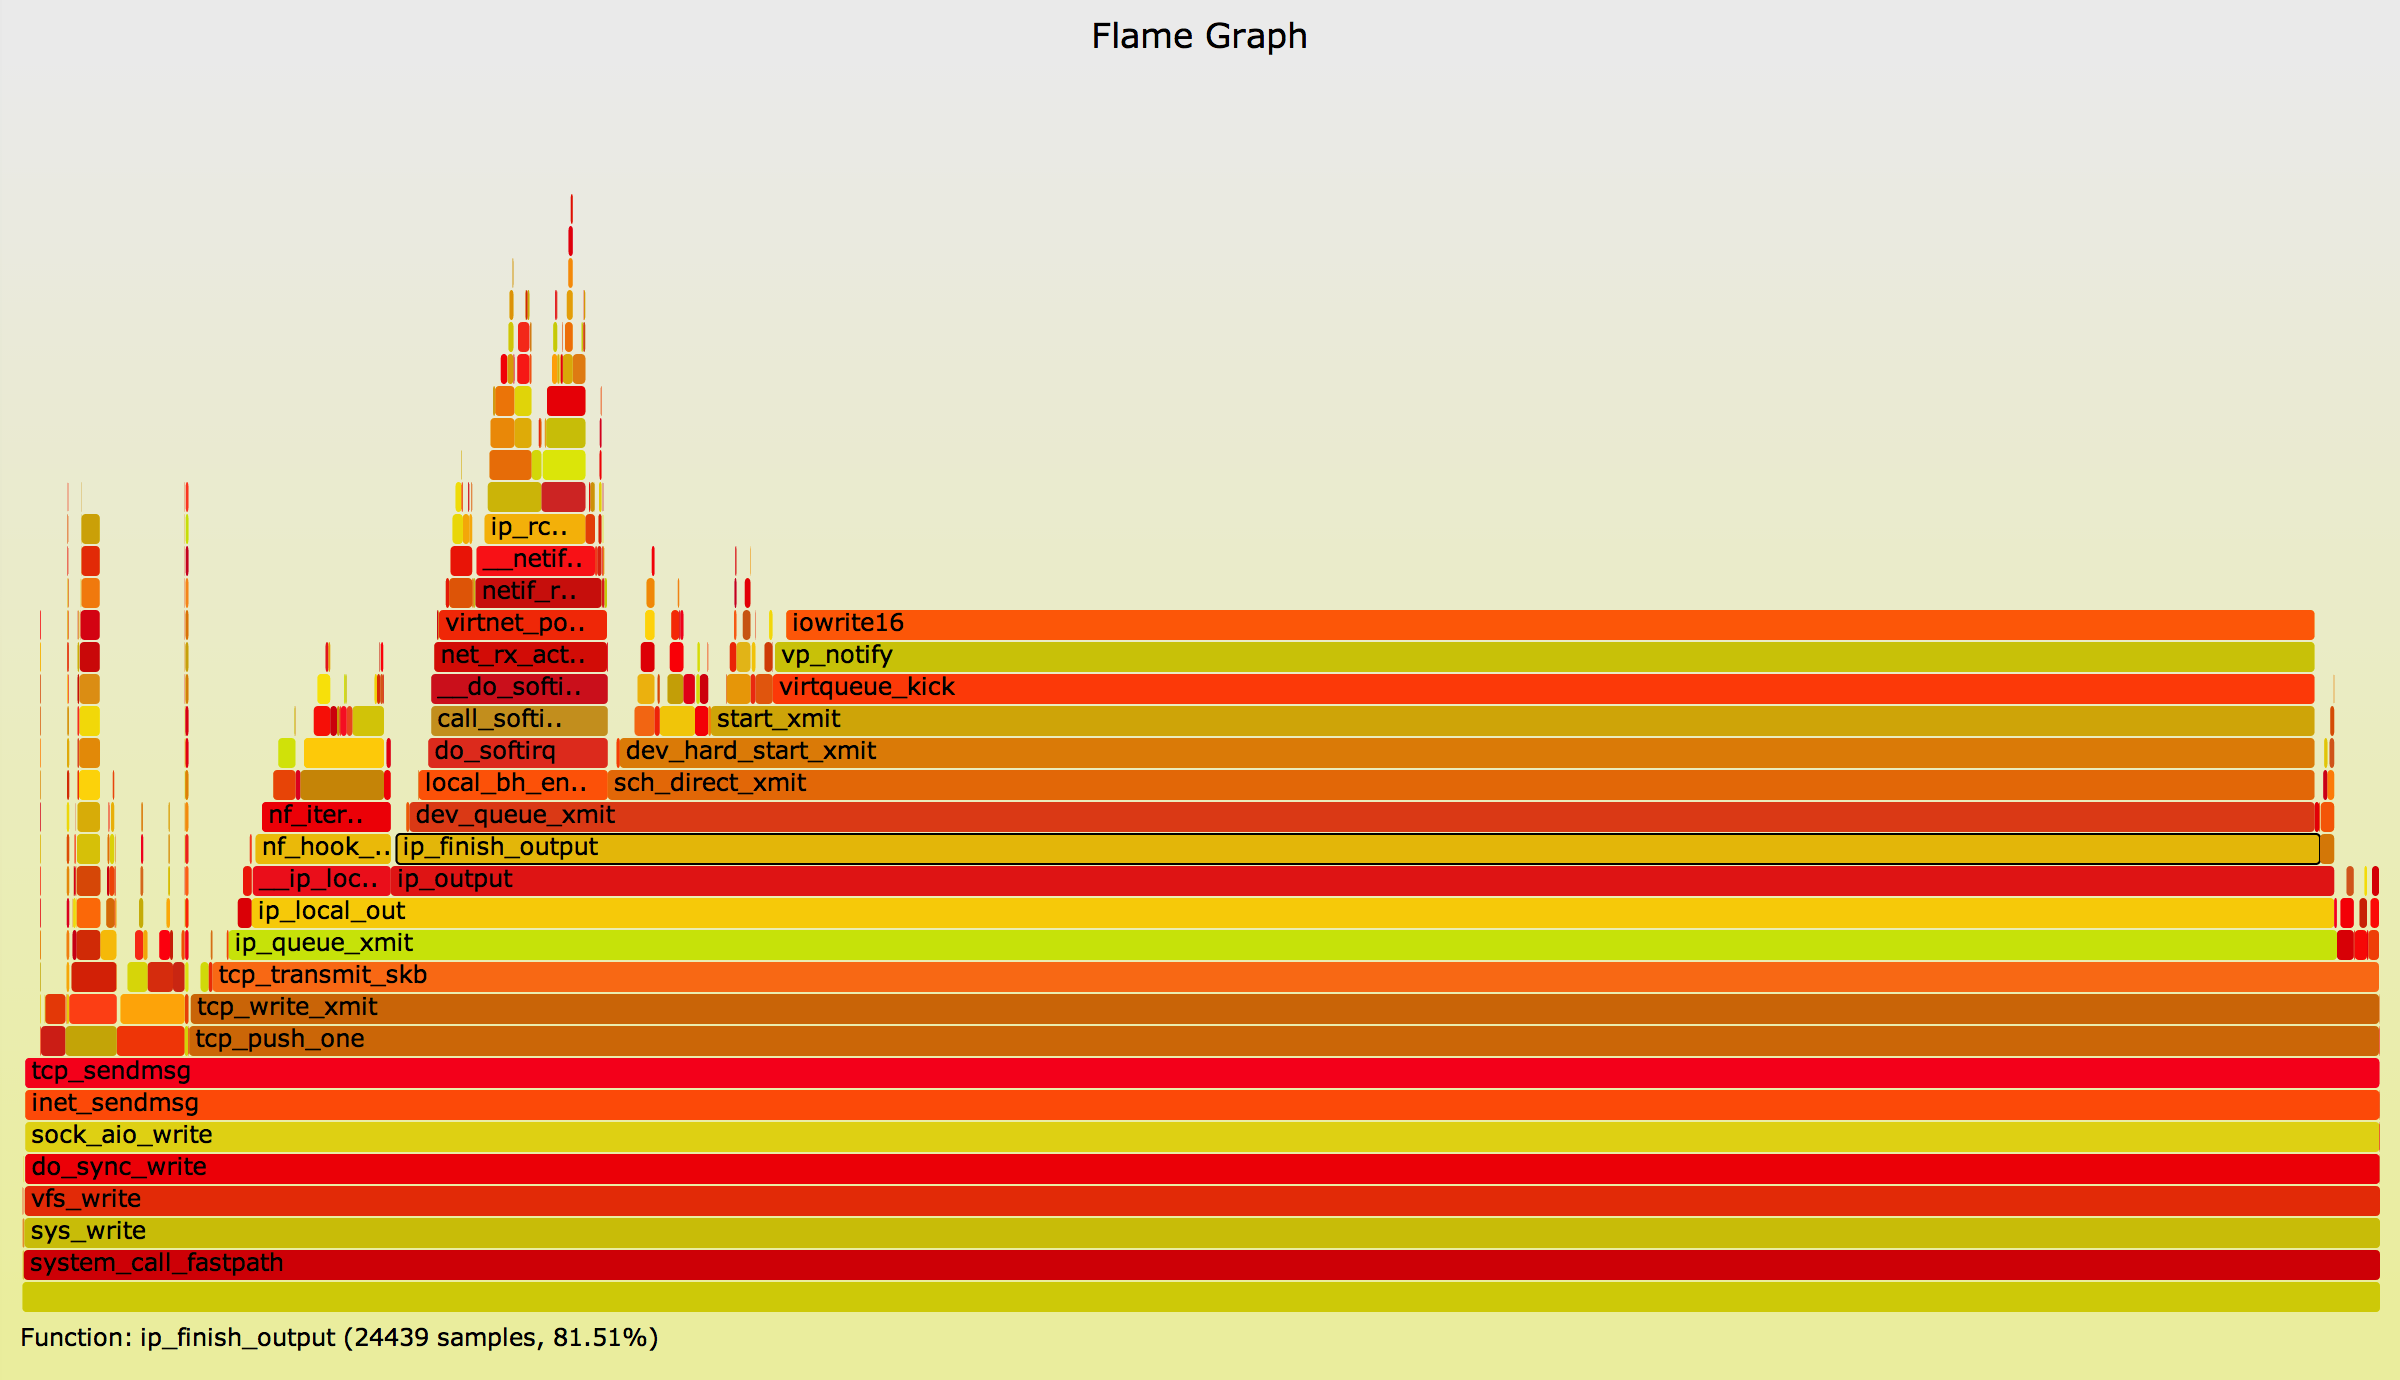
Flame Graphs show the sample population across the x-axis, and stack depth on the y-axis. Each function (stack frame) is drawn as a rectangle, with the width relative to the number of samples. See the CPU Flame Graphs page for the full description of how these work.
You can use the mouse to explore where kernel CPU time is spent, quickly quantifying code-paths and determining where performance tuning efforts are best spent. This example shows that most time was spent in the vp_notify() code-path, spending 70.52% of all on-CPU samples performing iowrite16(), which is handled by the KVM hypervisor. This information has been extremely useful for directing KVM performance efforts.
A similar network workload on a bare metal Linux system looks quite different, as networking isn't processed via the virtio-net driver, for a start.
Generation
The example flame graph was generated using perf_events and the FlameGraph tools (this is the old-fashioned method for Linux 2.6.X onwards; see the later Newer perf section):
# git clone https://github.com/brendangregg/FlameGraph  # or download it from github
# cd FlameGraph
# perf record -F 99 -ag -- sleep 60
# perf script | ./stackcollapse-perf.pl > out.perf-folded
# cat out.perf-folded | ./flamegraph.pl > perf-kernel.svg
The first perf command profiles CPU stacks, as explained earlier. I adjusted the rate to 99 Hertz here; I actually generated the flame graph from a 1000 Hertz profile, but I'd only use that if you had a reason to go faster, which costs more in overhead. The samples are saved in a perf.data file, which can be viewed using perf report:
# perf report --stdio
[...]
# Overhead          Command          Shared Object                               Symbol
# ........  ...............  .....................  ...................................
#
    72.18%            iperf  [kernel.kallsyms]      [k] iowrite16
                      |
                      --- iowrite16
                         |
                         |--99.53%-- vp_notify
                         |          virtqueue_kick
                         |          start_xmit
                         |          dev_hard_start_xmit
                         |          sch_direct_xmit
                         |          dev_queue_xmit
                         |          ip_finish_output
                         |          ip_output
                         |          ip_local_out
                         |          ip_queue_xmit
                         |          tcp_transmit_skb
                         |          tcp_write_xmit
                         |          |
                         |          |--98.16%-- tcp_push_one
                         |          |          tcp_sendmsg
                         |          |          inet_sendmsg
                         |          |          sock_aio_write
                         |          |          do_sync_write
                         |          |          vfs_write
                         |          |          sys_write
                         |          |          system_call
                         |          |          0x369e40e5cd
                         |          |
                         |           --1.84%-- __tcp_push_pending_frames
[...]
This tree follows the flame graph when reading it top-down. When using -g/--call-graph (for "caller", instead of the "callee" default), it generates a tree that follows the flame graph when read bottom-up. The hottest stack trace in the flame graph (@70.52%) can be seen in this perf call graph as the product of the top three nodes (72.18% x 99.53% x 98.16%).
The perf report tree (and the ncurses navigator) do an excellent job at presenting this information as text. However, with text there are limitations. The output often does not fit in one screen (you could say it doesn't need to, if the bulk of the samples are identified on the first page). Also, identifying the hottest code paths requires reading the percentages. With the flame graph, all the data is on screen at once, and the hottest code-paths are immediately obvious as the widest functions.
For generating the flame graph, the perf script command dumps the stack samples, which are then aggregated by stackcollapse-perf.pl and folded into single lines per-stack. That output is then converted by flamegraph.pl into the SVG. I included a gratuitous "cat" command to make it clear that flamegraph.pl can process the output of a pipe, which could include Unix commands to filter or preprocess (grep, sed, awk).
Piping
A flame graph can be generated directly by piping all the steps:
# perf script | ./stackcollapse-perf.pl | ./flamegraph.pl > perf-kernel.svg
In practice I don't do this, as I often re-run flamegraph.pl multiple times, and this one-liner would execute everything multiple times. The output of perf script can be dozens of Mbytes, taking many seconds to process. By writing stackcollapse-perf.pl to a file, you've cached the slowest step, and can also edit the file (vi) to delete unimportant stacks, such as CPU idle threads.
Filtering
The one-line-per-stack output of stackcollapse-perf.pl is also convenient for grep(1). E.g.:
# perf script | ./stackcollapse-perf.pl > out.perf-folded

# grep -v cpu_idle out.perf-folded | ./flamegraph.pl > nonidle.svg

# grep ext4 out.perf-folded | ./flamegraph.pl > ext4internals.svg

# egrep 'system_call.*sys_(read|write)' out.perf-folded | ./flamegraph.pl > rw.svg
I frequently elide the cpu_idle threads in this way, to focus on the real threads that are consuming CPU resources. If I miss this step, the cpu_idle threads can often dominate the flame graph, squeezing the interesting code paths.
Note that it would be a little more efficient to process the output of perf report instead of perf script; better still, perf report could have a report style (eg, "-g folded") that output folded stacks directly, obviating the need for stackcollapse-perf.pl. There could even be a perf mode that output the SVG directly (which wouldn't be the first one; see perf-timechart), although, that would miss the value of being able to grep the folded stacks (which I use frequently).
There are more examples of perf_events CPU flame graphs on the CPU flame graph page, including a summary of these instructions. I have also shared an example of using perf for a Block Device I/O Flame Graph.
Newer perf
perf has added features to aid flame graph generation. XXX
7.2. Heat Maps
Since perf_events can record high resolution timestamps (microseconds) for events, some latency measurements can be derived from trace data.
Example
The following heat map visualizes disk I/O latency data collected from perf_events (SVG, PNG):
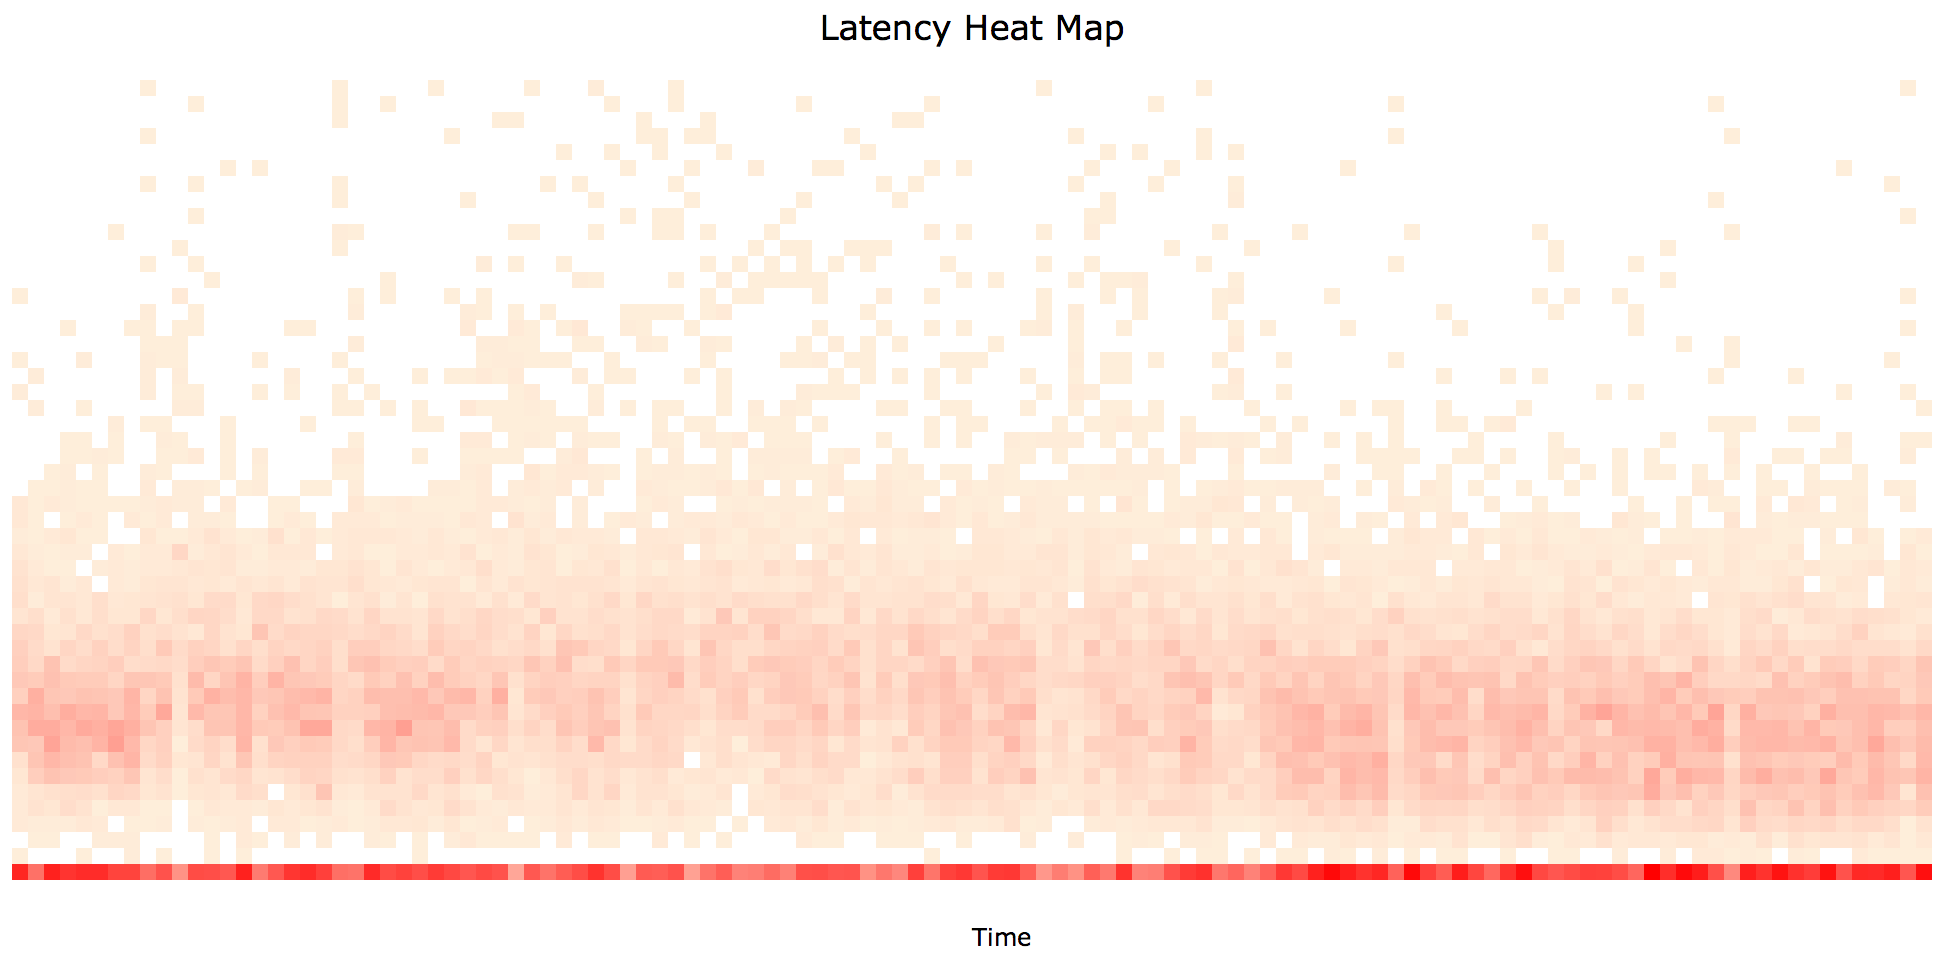
Mouse-over blocks to explore the latency distribution over time. The x-axis is the passage of time, the y-axis latency, and the z-axis (color) is the number of I/O at that time and latency range. The distribution is bimodal, with the dark line at the bottom showing that many disk I/O completed with sub-millisecond latency: cache hits. There is a cloud of disk I/O from about 3 ms to 25 ms, which would be caused by random disk I/O (and queueing). Both these modes averaged to the 9 ms we saw earlier.
The following iostat output was collected at the same time as the heat map data was collected (shows a typical one second summary):
# iostat -x 1
[...]
Device: rrqm/s wrqm/s    r/s   w/s   rkB/s wkB/s avgrq-sz avgqu-sz await r_await w_await svctm  %util
vda       0.00   0.00   0.00  0.00    0.00  0.00     0.00     0.00  0.00    0.00    0.00  0.00   0.00
vdb       0.00   0.00 334.00  0.00 2672.00  0.00    16.00     2.97  9.01    9.01    0.00  2.99 100.00
This workload has an average I/O time (await) of 9 milliseconds, which sounds like a fairly random workload on 7200 RPM disks. The problem is that we don't know the distribution from the iostat output, or any similar latency average. There could be latency outliers present, which is not visible in the average, and yet are causing problems. The heat map did show I/O up to 50 ms, which you might not have expected from that iostat output. There could also be multiple modes, as we saw in the heat map, which are also not visible in an average.
Gathering
I used perf_events to record the block request (disk I/O) issue and completion static tracepoints:
# perf record -e block:block_rq_issue -e block:block_rq_complete -a sleep 120
[ perf record: Woken up 36 times to write data ]
[ perf record: Captured and wrote 8.885 MB perf.data (~388174 samples) ]
# perf script
[...]
     randread.pl  2522 [000]  6011.824759: block:block_rq_issue: 254,16 R 0 () 7322849 + 16 [randread.pl]
     randread.pl  2520 [000]  6011.824866: block:block_rq_issue: 254,16 R 0 () 26144801 + 16 [randread.pl]
         swapper     0 [000]  6011.828913: block:block_rq_complete: 254,16 R () 31262577 + 16 [0]
     randread.pl  2521 [000]  6011.828970: block:block_rq_issue: 254,16 R 0 () 70295937 + 16 [randread.pl]
         swapper     0 [000]  6011.835862: block:block_rq_complete: 254,16 R () 26144801 + 16 [0]
     randread.pl  2520 [000]  6011.835932: block:block_rq_issue: 254,16 R 0 () 5495681 + 16 [randread.pl]
         swapper     0 [000]  6011.837988: block:block_rq_complete: 254,16 R () 7322849 + 16 [0]
     randread.pl  2522 [000]  6011.838051: block:block_rq_issue: 254,16 R 0 () 108589633 + 16 [randread.pl]
         swapper     0 [000]  6011.850615: block:block_rq_complete: 254,16 R () 108589633 + 16 [0]
[...]
The full output from perf script is about 70,000 lines. I've included some here so that you can see the kind of data available.
Processing
To calculate latency for each I/O, I'll need to pair up the issue and completion events, so that I can calculate the timestamp delta. The columns look straightforward (and are in include/trace/events/block.h), with the 4th field the timestamp in seconds (with microsecond resolution), the 6th field the disk device ID (major, minor), and a later field (which varies based on the tracepoint) has the disk offset. I'll use the disk device ID and offset as the unique identifier, assuming the kernel will not issue concurrent I/O to the exact same location.
I'll use awk to do these calculations and print the completion times and latency:
# perf script | awk '{ gsub(/:/, "") } $5 ~ /issue/ { ts[$6, $10] = $4 }
    $5 ~ /complete/ { if (l = ts[$6, $9]) { printf "%.f %.f\n", $4 * 1000000,
    ($4 - l) * 1000000; ts[$6, $10] = 0 } }' > out.lat_us
# more out.lat_us
6011793689 8437
6011797306 3488
6011798851 1283
6011806422 11248
6011824680 18210
6011824693 21908
[...]
I converted both columns to be microseconds, to make the next step easier.
Generation
Now I can use my trace2heatmap.pl program (github), to generate the interactive SVG heatmap from the trace data (and uses microseconds by default):
# ./trace2heatmap.pl --unitstime=us --unitslat=us --maxlat=50000 out.lat_us > out.svg
When I generated the heatmap, I truncated the y scale to 50 ms. You can adjust it to suit your investigation, increasing it to see more of the latency outliers, or decreasing it to reveal more resolution for the lower latencies: for example, with a 250 us limit.
Overheads
While this can be useful to do, be mindful of overheads. In my case, I had a low rate of disk I/O (~300 IOPS), which generated an 8 Mbyte trace file after 2 minutes. If your disk IOPS were 100x that, your trace file will also be 100x, and the overheads for gathering and processing will add up.
For more about latency heatmaps, see my LISA 2010 presentation slides, and my CACM 2010 article, both about heat maps. Also see my Perf Heat Maps blog post.
8. Targets
Notes on specific targets.
Under construction.
8.1. Java
8.2. Node.js
- Node.js V8 JIT internals with annotation support https://twitter.com/brendangregg/status/755838455549001728
9. More
There's more capabilities to perf_events than I've demonstrated here. I'll add examples of the other subcommands when I get a chance.
Here's a preview of perf trace, which was added in 3.7, demonstrated on 3.13.1:
# perf trace ls
     0.109 ( 0.000 ms):  ... [continued]: read()) = 1
     0.430 ( 0.000 ms):  ... [continued]: execve()) = -2
     0.565 ( 0.051 ms): execve(arg0: 140734989338352, arg1: 140734989358048, arg2: 40612288, arg3: 1407...
     0.697 ( 0.051 ms): execve(arg0: 140734989338353, arg1: 140734989358048, arg2: 40612288, arg3: 1407...
     0.797 ( 0.046 ms): execve(arg0: 140734989338358, arg1: 140734989358048, arg2: 40612288, arg3: 1407...
     0.915 ( 0.045 ms): execve(arg0: 140734989338359, arg1: 140734989358048, arg2: 40612288, arg3: 1407...
     1.030 ( 0.044 ms): execve(arg0: 140734989338362, arg1: 140734989358048, arg2: 40612288, arg3: 1407...
     1.414 ( 0.311 ms): execve(arg0: 140734989338363, arg1: 140734989358048, arg2: 40612288, arg3: 1407...
     2.156 ( 1.053 ms):  ... [continued]: brk()) = 0xac9000
     2.319 ( 1.215 ms):  ... [continued]: access()) = -1 ENOENT No such file or directory
     2.479 ( 1.376 ms):  ... [continued]: mmap()) = 0xb3a84000
     2.634 ( 0.052 ms): access(arg0: 139967406289504, arg1: 4, arg2: 139967408408688, arg3: 13996740839...
     2.787 ( 0.205 ms):  ... [continued]: open()) = 3
     2.919 ( 0.337 ms):  ... [continued]: fstat()) = 0
     3.049 ( 0.057 ms): mmap(arg0: 0, arg1: 22200, arg2: 1, arg3: 2, arg4: 3, arg5: 0         ) = 0xb3a...
     3.177 ( 0.184 ms):  ... [continued]: close()) = 0
     3.298 ( 0.043 ms): access(arg0: 139967406278152, arg1: 0, arg2: 6, arg3: 7146772199173811245, arg4...
     3.432 ( 0.049 ms): open(arg0: 139967408376811, arg1: 524288, arg2: 0, arg3: 139967408376810, arg4:...
     3.560 ( 0.045 ms): read(arg0: 3, arg1: 140737350651528, arg2: 832, arg3: 139967408376810, arg4: 14...
     3.684 ( 0.042 ms): fstat(arg0: 3, arg1: 140737350651216, arg2: 140737350651216, arg3: 354389249727...
     3.814 ( 0.054 ms): mmap(arg0: 0, arg1: 2221680, arg2: 5, arg3: 2050, arg4: 3, arg5: 0    ) = 0xb36...
[...]
An advantage is that this is buffered tracing, which costs much less overhead than strace, as I described earlier. The perf trace output seen from this 3.13.1 kernel does, however, looks suspicious for a number of reasons. I think this is still an in-development feature. It reminds me of my dtruss tool, which has a similar role, before I added code to print each system call in a custom and appropriate way.
10. Building
The steps to build perf_events depends on your kernel version and Linux distribution. In summary:
- Get the Linux kernel source that matches your currently running kernel (eg, from the linux-source package, or kernel.org).
- Unpack the kernel source.
- cd tools/perf
- make
- Fix all errors, and most warnings, from (4).
The first error may be that you are missing make, or a compiler (gcc). Once you have those, you may then see various warnings about missing libraries, which disable perf features. I'd install as many as possible, and take note of the ones you are missing.
These perf build warnings are really helpful, and are generated by its Makefile. Here's the makefile from 3.9.3:
# grep found Makefile
msg := $(warning No libelf found, disables 'probe' tool, please install elfutils-libelf-devel/libelf-dev);
msg := $(error No gnu/libc-version.h found, please install glibc-dev[el]/glibc-static);
msg := $(warning No libdw.h found or old libdw.h found or elfutils is older than 0.138, disables dwarf support.
 Please install new elfutils-devel/libdw-dev);
msg := $(warning No libunwind found, disabling post unwind support. Please install libunwind-dev[el] >= 0.99);
msg := $(warning No libaudit.h found, disables 'trace' tool, please install audit-libs-devel or libaudit-dev);
msg := $(warning newt not found, disables TUI support. Please install newt-devel or libnewt-dev);
msg := $(warning GTK2 not found, disables GTK2 support. Please install gtk2-devel or libgtk2.0-dev);
$(if $(1),$(warning No $(1) was found))
msg := $(warning No bfd.h/libbfd found, install binutils-dev[el]/zlib-static to gain symbol demangling)
msg := $(warning No numa.h found, disables 'perf bench numa mem' benchmark, please install numa-libs-devel or
 libnuma-dev);
Take the time to read them. This list is likely to grow as new features are added to perf_events.
The following notes show what I've specifically done for kernel versions and distributions, in case it is helpful.
Packages: Ubuntu, 3.8.6
Packages required for key functionality: gcc make bison flex elfutils libelf-dev libdw-dev libaudit-dev. You may also consider python-dev (for python scripting) and binutils-dev (for symbol demangling), which are larger packages.
Kernel Config: 3.8.6
Here are some kernel CONFIG options for perf_events functionality:
# for perf_events:
CONFIG_PERF_EVENTS=y
# for stack traces:
CONFIG_FRAME_POINTER=y
# kernel symbols:
CONFIG_KALLSYMS=y
# tracepoints:
CONFIG_TRACEPOINTS=y
# kernel function trace:
CONFIG_FTRACE=y
# kernel-level dynamic tracing:
CONFIG_KPROBES=y
CONFIG_KPROBE_EVENTS=y
# user-level dynamic tracing:
CONFIG_UPROBES=y
CONFIG_UPROBE_EVENTS=y
# full kernel debug info:
CONFIG_DEBUG_INFO=y
# kernel lock tracing:
CONFIG_LOCKDEP=y
# kernel lock tracing:
CONFIG_LOCK_STAT=y
# kernel dynamic tracepoint variables:
CONFIG_DEBUG_INFO=y
You may need to build your own kernel to enable these. The exact set you need depends on your needs and kernel version, and list is likely to grow as new features are added to perf_events.
10.1. Static Builds
I've sometimes done this so that I have a single perf binary that can be copied into Docker containers for execution. Steps, given the Linux source:
cd tools/perf
vi Makefile.perf
  LDFLAGS=-static
make clean; make
11. Troubleshooting
If you see hexadecimal numbers instead of symbols, or have truncated stack traces, see the Prerequisites section.
Here are some rough notes from other issues I've encountered.
This sometimes works (3.5.7.2) and sometimes throws the following error (3.9.3):
ubuntu# perf stat -e 'syscalls:sys_enter_*' -a sleep 5
Error:
Too many events are opened.
Try again after reducing the number of events.
This can be fixed by increasing the file descriptor limit using ulimit -n.
Type 3 errors:
ubuntu# perf report
0xab7e48 [0x30]: failed to process type: 3
# ========
# captured on: Tue Jan 28 21:08:31 2014
# hostname : pgbackup
# os release : 3.9.3-ubuntu-12-opt
# perf version : 3.9.3
# arch : x86_64
# nrcpus online : 8
# nrcpus avail : 8
# cpudesc : Intel(R) Xeon(R) CPU E5-2670 0 @ 2.60GHz
# cpuid : GenuineIntel,6,45,7
# total memory : 8179104 kB
# cmdline : /lib/modules/3.9.3-ubuntu-12-opt/build/tools/perf/perf record
 -e sched:sched_process_exec -a
# event : name = sched:sched_process_exec, type = 2, config = 0x125, config1 = 0x0,
 config2 = 0x0, excl_usr = 0, excl_kern = 0, excl_host = 0, excl_guest = 1, precise_ip = 0
# HEADER_CPU_TOPOLOGY info available, use -I to display
# HEADER_NUMA_TOPOLOGY info available, use -I to display
# pmu mappings: software = 1, tracepoint = 2, breakpoint = 5
# ========
#
Warning: Timestamp below last timeslice flush
12. Other Tools
perf_events has the capabilities from many other tools rolled into one: strace(1), for tracing system calls, tcpdump(8), for tracing network packets, and blktrace(1), for tracing block device I/O (disk I/O), and other targets including file system and scheduler events. Tracing all events from one tool is not only convenient, it also allows direct correlations, including timestamps, between different instrumentation sources. Unlike these other tools, some assembly is required, which may not be for everyone (as explained in Audience).
13. Resources
Resources for further study.
13.1. Posts
I've been writing blog posts on specific perf_events topics. My suggested reading order is from oldest to newest (top down):
- 22 Jun 2014: perf CPU Sampling
- 29 Jun 2014: perf Static Tracepoints
- 01 Jul 2014: perf Heat Maps
- 03 Jul 2014: perf Counting
- 10 Jul 2014: perf Hacktogram
- 11 Sep 2014: Linux perf Rides the Rocket: perf Kernel Line Tracing
- 17 Sep 2014: node.js Flame Graphs on Linux
- 26 Feb 2015: Linux perf_events Off-CPU Time Flame Graph
- 27 Feb 2015: Linux Profiling at Netflix
- 24 Jul 2015: Java Mixed-Mode Flame Graphs (PDF)
- 30 Apr 2016: Linux 4.5 perf folded format
And posts on ftrace:
- 13 Jul 2014: Linux ftrace Function Counting
- 16 Jul 2014: iosnoop for Linux
- 23 Jul 2014: Linux iosnoop Latency Heat Maps
- 25 Jul 2014: opensnoop for Linux
- 28 Jul 2014: execsnoop for Linux: See Short-Lived Processes
- 30 Aug 2014: ftrace: The Hidden Light Switch
- 06 Sep 2014: tcpretrans: Tracing TCP retransmits
- 31 Dec 2014: Linux Page Cache Hit Ratio
- 28 Jun 2015: uprobe: User-Level Dynamic Tracing
- 03 Jul 2015: Hacking Linux USDT
13.2. Links
perf_events:
- perf-tools (github), a collection of my performance analysis tools based on Linux perf_events and ftrace.
- perf Main Page.
- The excellent perf Tutorial, which focuses more on CPU hardware counters.
- The Unofficial Linux Perf Events Web-Page by Vince Weaver.
- The perf user mailing list.
- Mischa Jonker's presentation Fighting latency: How to optimize your system using perf (PDF) (2013).
- The OMG SO PERF T-shirt (site has coarse language).
- Shannon Cepeda's great posts on pipeline speak: frontend and backend.
- Jiri Olsa's dwarf mode callchain patch.
- Linux kernel source: tools/perf/Documentation/examples.txt.
- Linux kernel source: tools/perf/Documentation/perf-record.txt.
- ... and other documentation under tools/perf/Documentation.
- A good case study for Transparent Hugepages: measuring the performance impact using perf and PMCs.
- Julia Evans created a perf cheatsheet based on my one-liners (2017).
- Denis Bakhvalov has a great post on PEBS and LBR internals.
ftrace:
- perf-tools (github), a collection of my performance analysis tools based on Linux perf_events and ftrace.
- Ftrace: The hidden light switch, by myself for lwn.net, Aug 2014.
- Linux kernel source: Documentation/trace/ftrace.txt.
- lwn.net Secrets of the Ftrace function tracer, by Steven Rostedt, Jan 2010.
- lwn.net Debugging the kernel using Ftrace - part 1, by Steven Rostedt, Dec 2009.
- lwn.net Debugging the kernel using Ftrace - part 2, by Steven Rostedt, Dec 2009.
14. Email
Have a question? If you work at Netflix, contact me. If not, please use the perf user mailing list, which I and other perf users are on.