

Flame Scope
This is the official website for flame scope: a performance visualization for studying variance, perturbations, single-theaded execution, execution phases, application startup, and more. The original use case was for quickly understanding a CPU profile of timer-based samples down to millisecond resolution. They were created to complement Flame Graphs, providing a way to study time-based variance within a flame graph.
The first flame scope implementations are both open source, and are my Perl FlameScope and Martin Spier's d3 flamescope (we were both on the Netflix performance engineering team when we developed these).
Summary
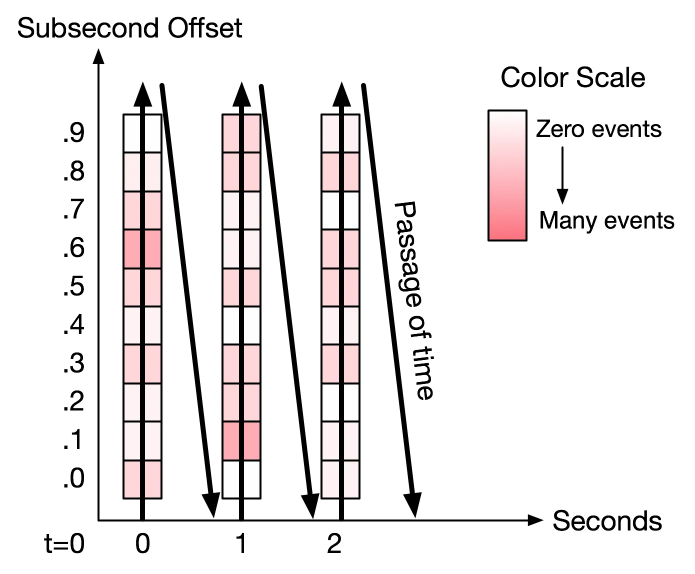
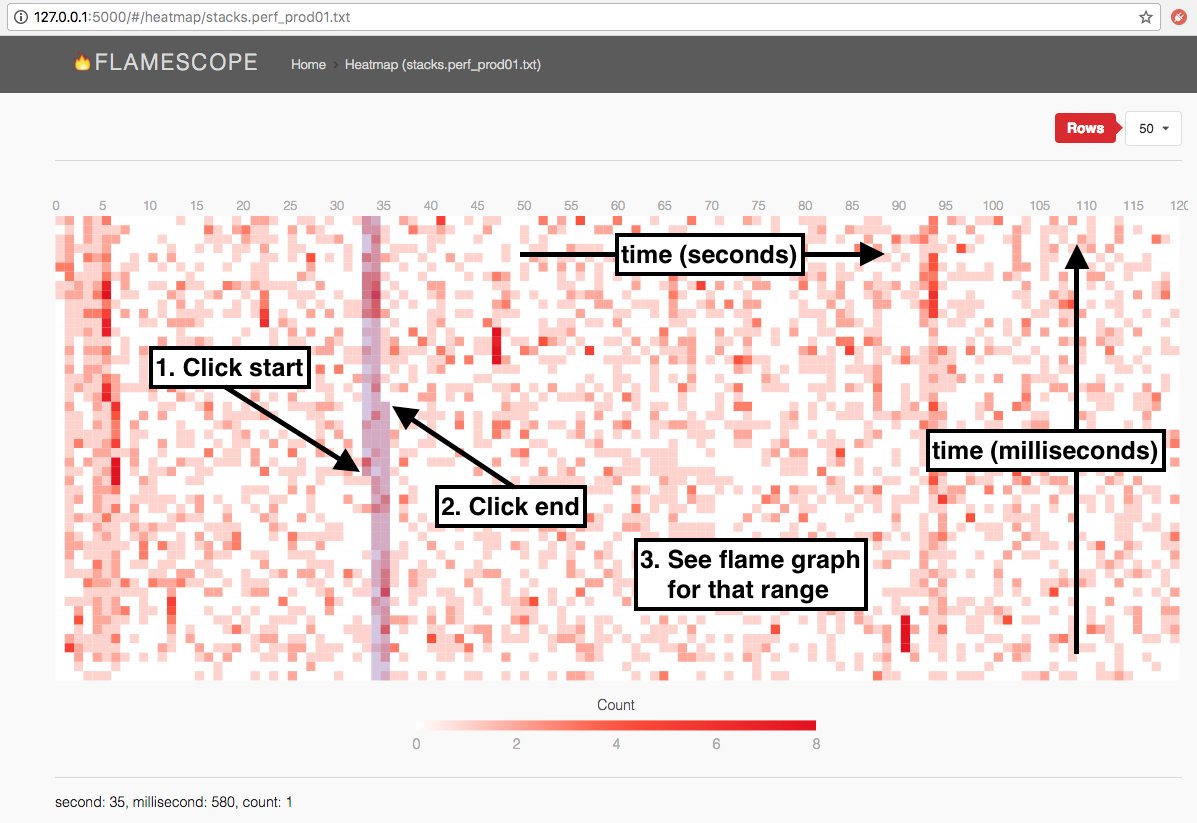
Time in on both axes. Samples are grouped into time-range buckets, drawn as colored blocks, where the color shows how many samples fell into that time range: darker for more. These buckets are painted from bottom to top in a column, and then the next column and so on, as shown in the diagram on the right. By default FlameScope arranges these as a subsecond offset heat map, where each column is one full second and each of the 50 rows spans a 20ms slice. The end user can then select a time range in the heat map, and a flame graph is generated for just that time range. This allows perturbations and variations to be easily seen in the heat map, selected, and their responsible code paths studied.
This default arrangement highlights patterns that occur each second. Other arrangements are possible: with low-frequency continuous profiling, you could make a sub-hour offset heat map where the y-axis spanned a full hour, with 60 rows -- one for each minute.
Here is FlameScope summarized in one image:
Is it FlameScope or Flame Scope or flame scope? FlameScope refers to the original tools (which is also a better search term) and flame scope can refer to the thing it makes. That usage would be similar to how "flame graphs" can be generated by my "FlameGraph" tool or by many other tools.
Presentation
I gave a talk about FlameScope pattern recognition with Martin Spier at the LinkedIn Performance Engineering meetup youtube, slides:
This is one of my favorite talks: 19 slides -- most of the presentation -- have no text as the pictures do the talking. (Well actually I did the talking. But you know what I mean.)
Origin
At Netflix in early 2018 my colleague Vadim was debugging an intermittent performance issue where application request latency increased for about 5 seconds once every 15 minutes. We suspected there was a short burst in CPU usage causing it. Vadim was able to capture a 15-minute CPU profile consisting of timed stack samples (using Linux perf) but this was thouands of pages of output that was laborious to read as text. I turned it into a flame graph, but a 5 second perturbation in a 15 minute profile would amount to <1%: hard to see. I manually sliced the profile into smaller time windows, creating a flame graph for each, and figured out there had to be a better way. I tried some different visualizations of the profile samples and found subsecond-offset heat maps to work best, revealing not just perturabations and variance, but also periodic activity.
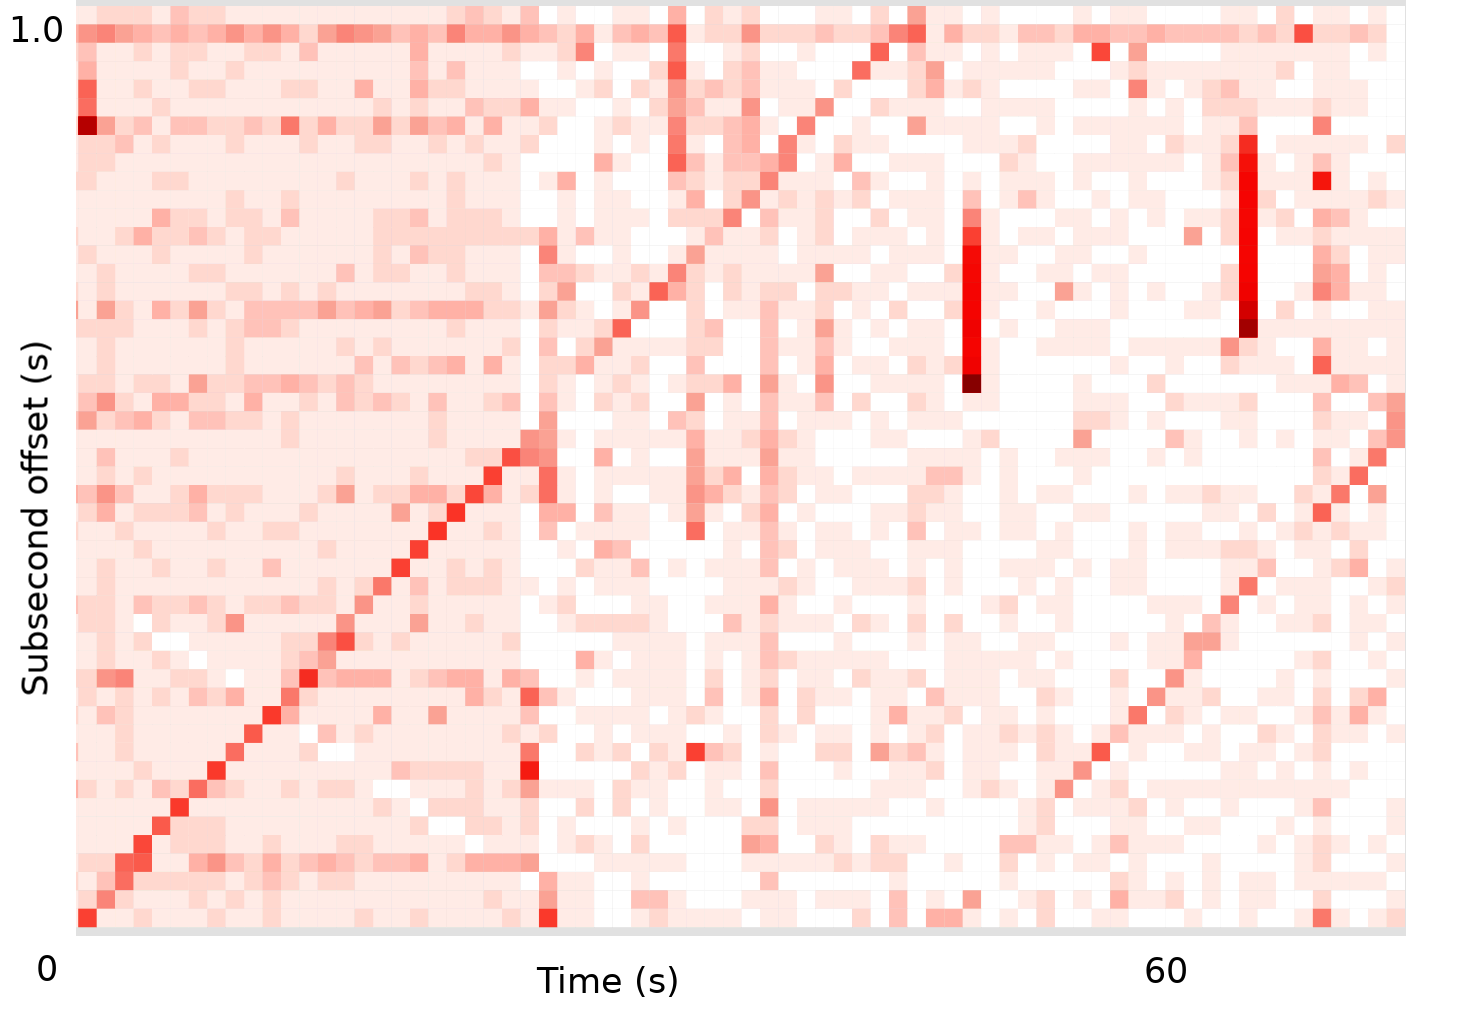
This is the first flame scope heat map that I generated:

(Interactive SVG, PNG.) The main performance issue happened to be in the first five seconds, appearing as the darker column on the left edge. My FlameScope tool allowed this to be seleted, generating a flame graph just for that range, revealing the problem. See FlameScope Origin for more details.
Links
- https://github.com/brendangregg/FlameScope: my original prototype implementations in Perl and Python: they may not work anymore without fixes.
- https://github.com/Netflix/flamescope: Martin Spier's d3 flame scope.
- Netflix FlameScope: My introductory post on the Netflix TechBlog (PDF).
- FlameScope Origin: Summarizing the origin story.
- FlameScope Pattern Recognition: Showing the many details flame scopes can reveal.
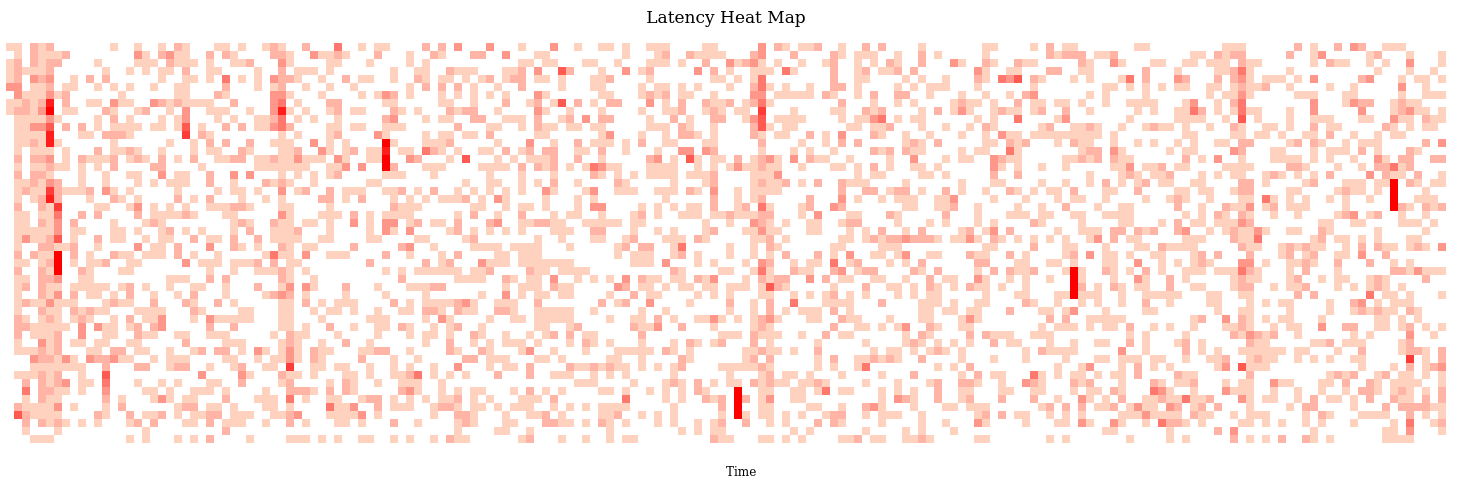
Various examples of from the FlameScope Pattern Recognition post:
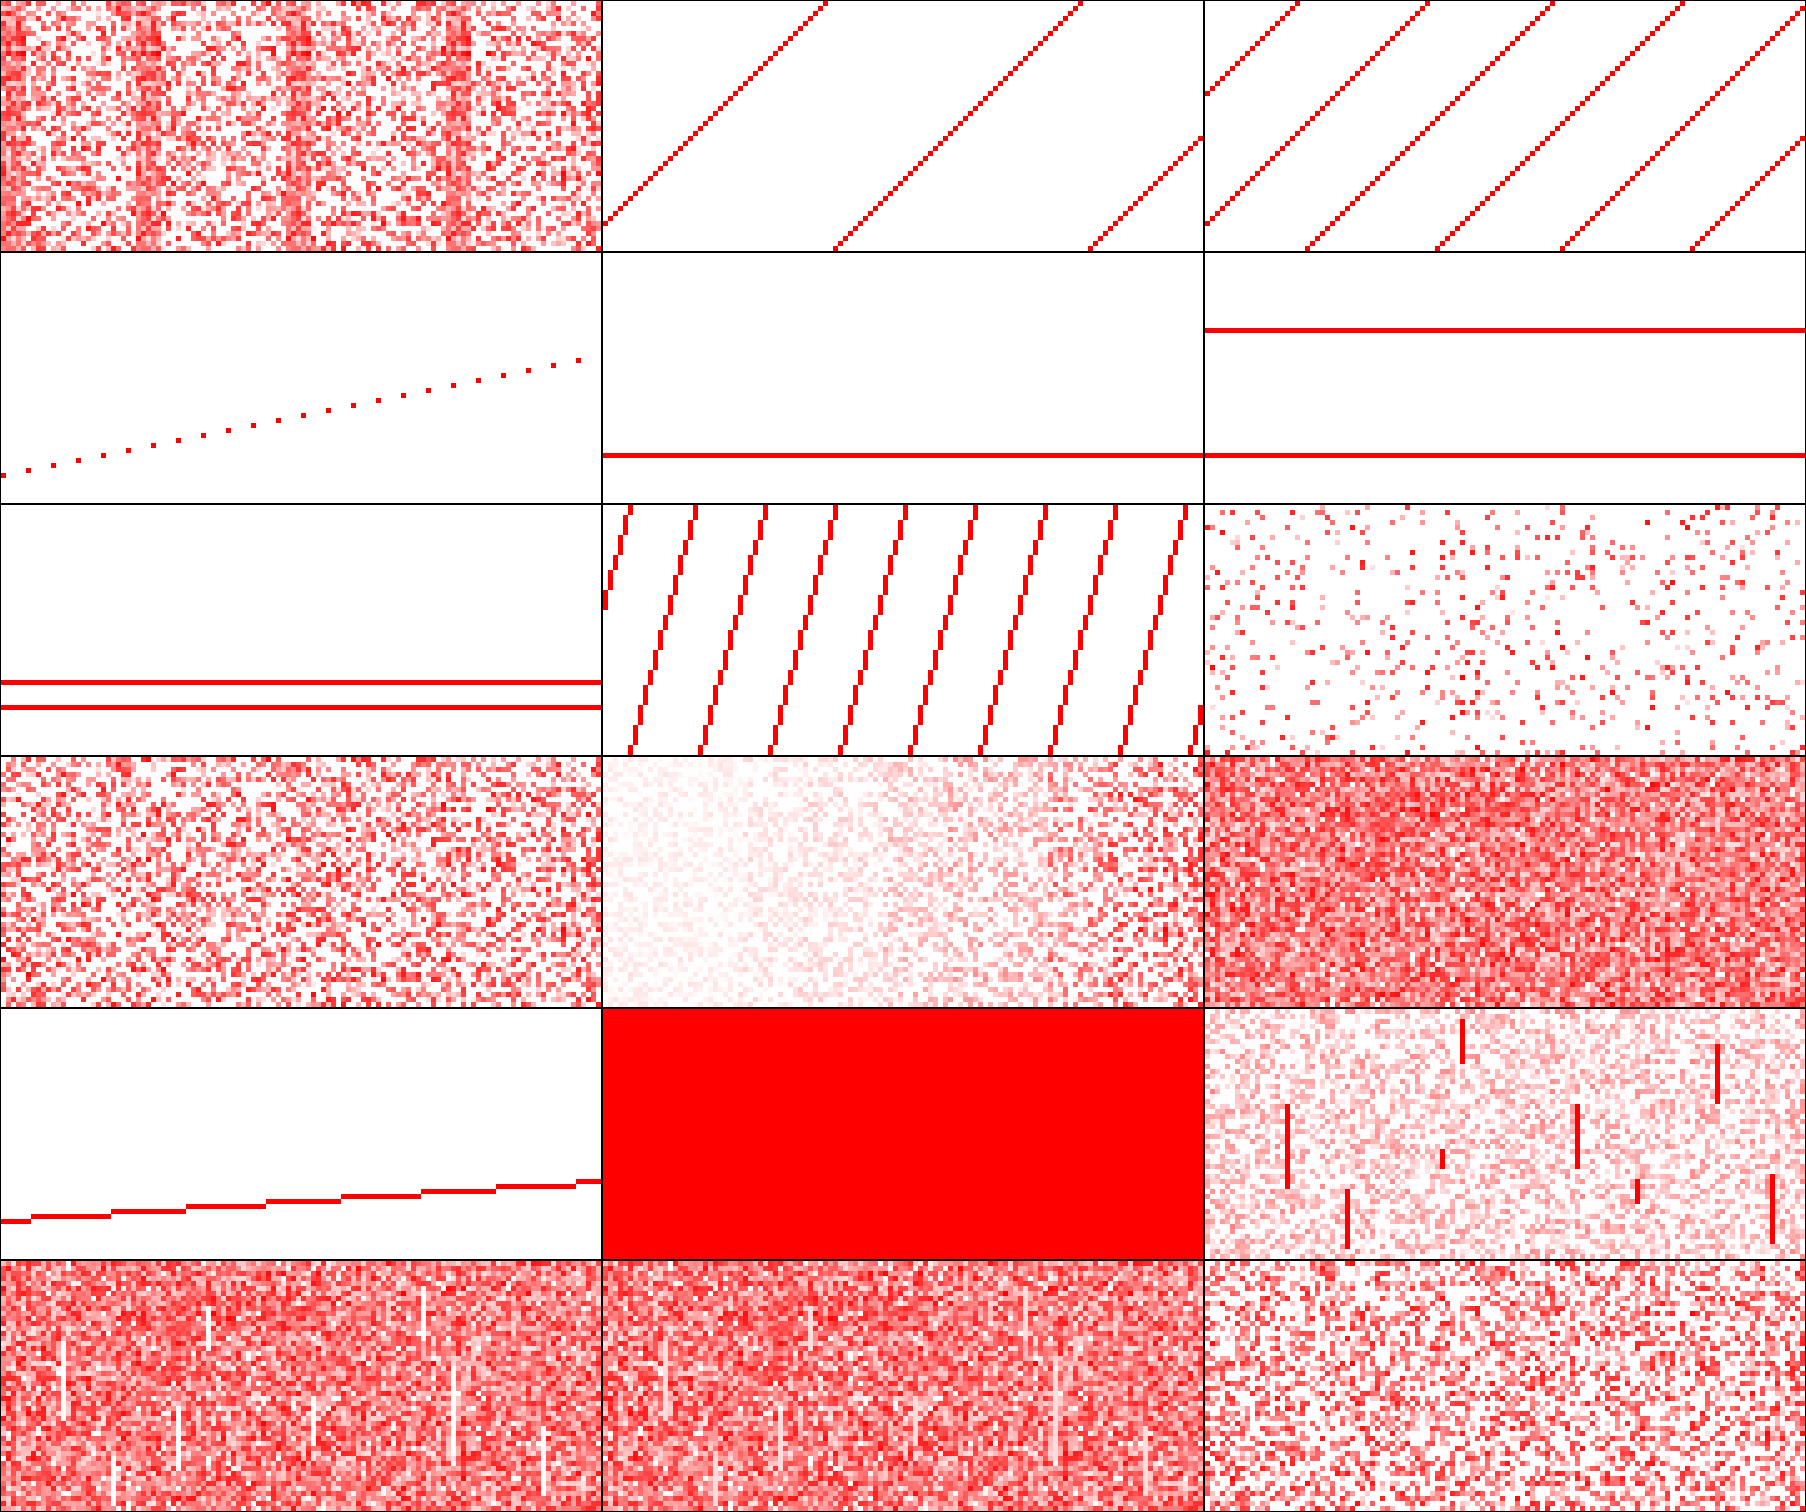
Can you guess what each pattern means?
Updates
FlameScope was released in Apr 2018.
todo: fill in with links.