Off-CPU Analysis
Performance issues can be categorized into one of two types:
- On-CPU: where threads are spending time running on-CPU.
- Off-CPU: where time is spent waiting while blocked on I/O, locks, timers, paging/swapping, etc.
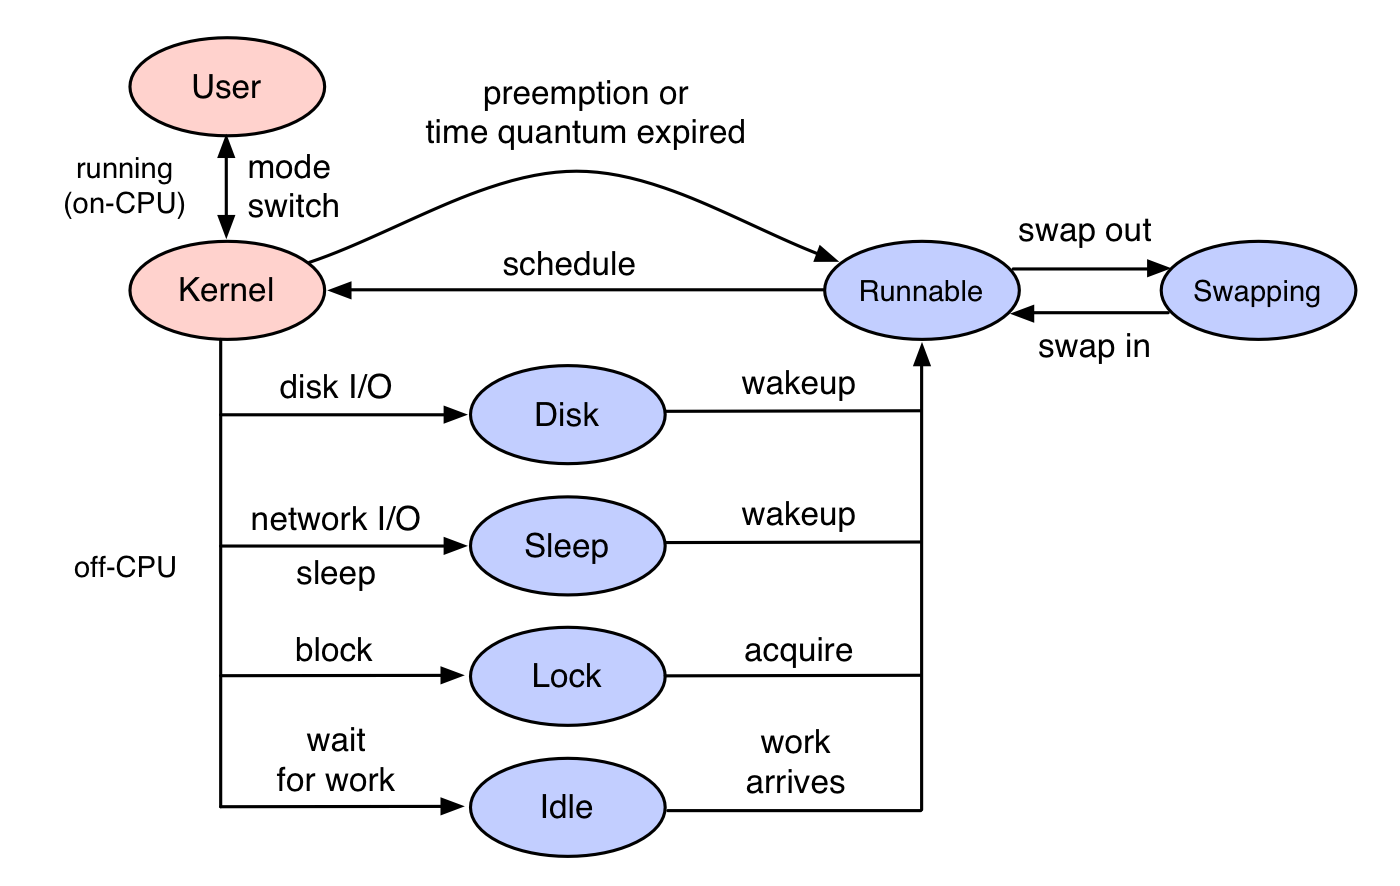
Off-CPU analysis is a performance methodology where off-CPU time is measured and studied, along with context such as stack traces. It differs from CPU profiling, which only examines threads if they are executing on-CPU. Here, the target are thread states that are blocked and off-CPU, as shown in blue in the diagram on the right.
Off-CPU analysis is complementary to CPU analysis, so that 100% of thread time can be understood. This method also differs from tracing techniques that instrument applications functions that commonly block, since this method targets the kernel scheduler's notion of blocking, which is a convenient catch-all.
Threads can leave CPU for a number of reasons, including I/O and locks, but also some that are unrelated to the current thread's execution, including involuntary context switching due to high demand for CPU resources, and interrupts. Whatever the reason, if this occurs during a workload request (a synchronous code-path), then it is introducing latency.
On this page I'll introduce off-CPU time as a metric, and summarize techniques for off-CPU analysis. As an example implementation of off-CPU analysis I'll apply it to Linux, then summarize other OSes in later sections.
Table of contents:
|
1. Prerequisites 2. Introduction 3. Overhead 4. Linux 5. Off-CPU Time 6. Off-CPU Analysis 7. Request Context 8. Caveats |
9. Flame Graphs 10. Wakeups 11. Other OSes 12. Origin 13. Summary 14. Updates |
Prerequisites
Off-CPU analysis require stack traces to be available to tracers, which you may need to fix first. Many applications are compiled with the -fomit-frame-pointer gcc option, breaking frame pointer-based stack walking. VM runtimes like Java compile methods on the fly, and tracers may not find their symbol information without additional help, causing the stack trace to be hexadecimal only. There are other gotchas as well. See my previous write ups on fixing Stack Traces and JIT Symbols for perf.
Introduction
To explain the role of off-CPU analysis, I'll summarize CPU sampling and tracing first for comparison. I'll then summarize two off-CPU analysis approaches: tracing, and sampling. While I've been promoting off-CPU analysis for over a decade, it is still not a widely used methodology, in part due to the lack of tools in production Linux environments to measure it. That is now changing with eBPF and newer Linux kernels (4.8+).
1. CPU Sampling
Many traditional profiling tools use timed sampling of activity across all CPUs, collecting snapshots of the current instruction address (program counter) or entire stack back trace at a certain time interval or rate (eg, 99 Hertz). This will give counts of either the running function or the stack trace, allowing reasonable estimates to be calculated of where the CPU cycles are being spent. On Linux, the perf tool in sampling mode (eg, -F 99) does timed CPU sampling.
Consider application function A() calls function B(), which makes a blocking system call:
    CPU Sampling ----------------------------------------------->
     |  |  |  |  |  |  |                      |  |  |  |  |
     A  A  A  A  B  B  B                      B  A  A  A  A
    A(---------.                                .----------)
               |                                |
               B(--------.                   .--)
                         |                   |         user-land
   - - - - - - - - - - syscall - - - - - - - - - - - - - - - - -
                         |                   |         kernel
                         X     Off-CPU       |
                       block . . . . . interrupt
While this can be very effective for studying on-CPU issues, including hot code-paths and adaptive mutex spins, it doesn't gather data when the application has blocked and is waiting off-CPU.
2. Application Tracing
    App Tracing ------------------------------------------------>
    |          |                                |          |
    A(         B(                               B)         A)

    A(---------.                                .----------)
               |                                |
               B(--------.                   .--)
                         |                   |         user-land
   - - - - - - - - - - syscall - - - - - - - - - - - - - - - - -
                         |                   |         kernel
                         X     Off-CPU       |
                       block . . . . . interrupt
Here functions are instrumented so that timestamps are collected when they begin "(" and end ")", so that the time spent in functions can be calculated. If the timestamps include elapsed time and CPU time (eg, using times(2) or getrusage(2)), then it is also possible to calculate which functions were slow on-CPU vs which functions were slow because they were blocked off-CPU. Unlike sampling, these timestamps can have a very high resolution (nanoseconds).
While this works, a disadvantage is that you either trace all application functions, which can have a significant performance impact (and affect the performance you are trying to measure), or you pick the functions that are likely to block, and hope you didn't miss any.
3. Off-CPU Tracing
I'll summarize this here, then explain it in more detail in the next sections.
    Off-CPU Tracing -------------------------------------------->
                         |                   |
                         B                   B
                         A                   A
    A(---------.                                .----------)
               |                                |
               B(--------.                   .--)
                         |                   |         user-land
   - - - - - - - - - - syscall - - - - - - - - - - - - - - - - -
                         |                   |         kernel
                         X     Off-CPU       |
                       block . . . . . interrupt
With this approach, only the kernel functions that switch the thread off-CPU are traced, along with timestamps and user-land stack traces. This focuses on the off-CPU events, without needing to trace all of the application functions, or needing to know what the application is. This approach works for any blocking event, for any application: MySQL, Apache, Java, etc.
Off-CPU tracing captures all wait events for any application.
Later on this page I'll trace kernel off-CPU events and include some application level instrumentation to filter out asynchronous wait times (eg, threads waiting for work). Unlike application level instrumentation, I don't need to hunt down every place that may block off-CPU; I just need to identify that the application is in a time sensitive code path (eg, during a MySQL query), so that the latency is synchronous to the workload.
Off-CPU tracing is the main approach I've been using for Off-CPU analysis. But there's also sampling.
4. Off-CPU Sampling
    Off-CPU Sampling ------------------------------------------->
                          |  |  |  |  |  |  |
                          O  O  O  O  O  O  O
    A(---------.                                .----------)
               |                                |
               B(--------.                   .--)
                         |                   |         user-land
   - - - - - - - - - - syscall - - - - - - - - - - - - - - - - -
                         |                   |         kernel
                         X     Off-CPU       |
                       block . . . . . interrupt
This approach uses timed sampling to capture blocked stack traces from threads that are not running on-CPU. It can also be accomplished by a wall-time profiler: one that samples all threads all the time, regardless of whether they are on- or off-CPU. The wall-time profile output can then be filtered to look for just the off-CPU stacks.
Off-CPU sampling is rarely used by system profilers. Sampling is usually implemented as per-CPU timer interrupts, that then examine the currently running process that was interrupted: producing an on-CPU profile. An off-CPU sampler must work in a different way: either setting up timers in each application thread to wake them up and capture stacks, or having the kernel walk all threads at an interval and capture their stacks.
Overhead
WARNING: With off-CPU tracing, be aware that scheduler events can be very frequent – in extreme cases, millions of events per second – and although tracers may only add a tiny amount of overhead to each event, due to the event rate that overhead can add up and become significant. Off-CPU sampling has overhead issues too, as systems may have tens of thousands of threads which must be constantly sampled, orders of magnitude higher overhead than CPU sampling across the CPU count only.
To use off-CPU analysis, you'll want to pay attention to overheads every step of the way. Tracers that dump every event to user-space for post processing can easily become prohibitive, creating Gbytes of trace data per minute. That data must be written to the file system and storage devices and post-processed, costing more CPU. This is why tracers that can do in-kernel summaries, like Linux eBPF, are so important for reducing overhead and making off-CPU analysis practical. Also beware of feedback loops: tracers tracing events caused by themselves.
If I'm completely in the dark with a new scheduler tracer, I'll begin by tracing for one tenth of a second only (0.1s), and then ratchet it up from there, while closely measuring the impact on system CPU utilization, application request rates, and application latency. I'll also consider the rate of context switches (eg, measured via the "cs" column in vmstat), and be more careful on servers with higher rates.
To give you some idea of the overheads, I tested an 8 CPU system running Linux 4.15, with a heavy MySQL load causing 102k context switches per second. The server was running at CPU saturation (0% idle) on purpose, so that any tracer overhead will cause a noticeable loss in application performance. I then compared off-CPU analysis via scheduler tracing with Linux perf and eBPF, which demonstrate different approaches: perf for event dumping, and eBPF for in-kernel summarizing:
- Using perf to trace every scheduler event caused a 9% drop in throughput while tracing, with occasional 12% drops while the perf.data capture file was flushed to disk. That file ended up 224 Mbytes for 10 seconds of tracing. The file was then post processed by running perf script to do symbol translation, which cost a 13% performance drop (the loss of 1 CPU) for 35 seconds. You could summarize this by saying the 10 second perf trace cost 9-13% overhead for 45 seconds.
- Using eBPF to count stacks in kernel context instead caused a 6% drop in throughput during the 10 second trace, which began with a 13% drop for 1 second as eBPF was initialized, and was followed by 6 seconds of post-processing (symbol resolution of the already-summarized stacks) costing a 13% drop. So a 10 second trace cost 6-13% overhead for 17 seconds. Much better.
What happens when the trace duration is increased? For eBPF it's only capturing and translating unique stacks, which won't scale linearly with the trace duration. I tested this by increasing the trace from 10 to 60 seconds, which only increased eBPF post processing from 6 to 7 seconds. The same with perf increased its post processing from 35 seconds to 212 seconds, as it needed to process 6x the volume of data. To finish understanding this fully, it's worth noting that post processing is a user-level activity that can be tuned to interfere less with the production workload, such as by using different scheduler priorities. Imagine capping CPU at 10% (of one CPU) for this activity: the performance loss may then be negligible, and the eBPF post-processing stage may then take 70 seconds – not too bad. But the perf script time may then take 2120 seconds (35 minutes), which would stall an investigation. And perf's overhead isn't just CPU, it's also disk I/O.
How does this MySQL example compare to production workloads? It was doing 102k context switches per second, which is relatively high: many production systems I see at the moment are in the 20-50k/s range. That would suggest that the overheads described here are about 2x higher than I would see on those production systems. However, the MySQL stack depth is relatively light, often only 20-40 frames, whereas production applications can exceed 100 frames. That matters as well, and may mean that my MySQL stack walking overheads are perhaps only half what I would see in production. So this may balance out for my production systems.
Linux: perf, eBPF
Off-CPU analysis is a generic approach that should work on any operating system. I'll demonstrate doing it on Linux using off-CPU tracing, then summarize other OSes in later sections.
There are many tracers available on Linux for off-CPU analysis. I'll use eBPF here, as it can easily do in-kernel summaries of stack traces and times. eBPF is part of the Linux kernel, and I'll use it via the bcc frontend tools. These need at least Linux 4.8 for stack trace support.
You may wonder how I did off-CPU analysis before eBPF. Lots of different ways, including completely different approaches for each blocking type: storage tracing for storage I/O, kernel statistics for scheduler latency, and so on. To actually do off-CPU analysis before, I've used SystemTap, and also perf event logging – although that has higher overhead (I wrote about it in perf_events Off-CPU Time Flame Graph). At one point I wrote a simple wall-time kernel-stack profiler called proc-profiler.pl, which sampled /proc/PID/stack for a given PID. It worked well enough. I'm not the first to hack up such a wall-time profiler either, see poormansprofiler and Tanel Poder's quick'n'dirty troubleshooting.
Off-CPU Time
This is the time that threads spent waiting off-CPU (blocked time), and not running on-CPU. It can be measured as totals across a duration (already provided by /proc statistics), or measured for each blocking event (usually requires a tracer).
To start with, I'll show total off-CPU time from a tool that may already be familiar to you. The time(1) command. Eg, timing tar(1):
$ time tar cf archive.tar linux-4.15-rc2

real	0m50.798s
user	0m1.048s
sys	0m11.627s
tar took about one minute to run, but the time command shows it only spent 1.0 seconds of user-mode CPU time, and 11.6 seconds of kernel-mode CPU time, out of a total 50.8 seconds of elapsed time. We are missing 38.2 seconds! That is the time the tar command was blocked off-CPU, no doubt doing storage I/O as part of its archive generation.
To examine off-CPU time in more detail, either dynamic tracing of kernel scheduler functions or static tracing using the sched tracepoints can be used. The bcc/eBPF project includes cpudist that does this, developed by Sasha Goldshtein, which has a -O mode that measures off-CPU time. This requires Linux 4.4 or higher. Measuring tar's off-CPU time:
# /usr/share/bcc/tools/cpudist -O -p `pgrep -nx tar`
Tracing off-CPU time... Hit Ctrl-C to end.
^C
     usecs               : count     distribution
         0 -> 1          : 3        |                                        |
         2 -> 3          : 50       |                                        |
         4 -> 7          : 289      |                                        |
         8 -> 15         : 342      |                                        |
        16 -> 31         : 517      |                                        |
        32 -> 63         : 5862     |***                                     |
        64 -> 127        : 30135    |****************                        |
       128 -> 255        : 71618    |****************************************|
       256 -> 511        : 37862    |*********************                   |
       512 -> 1023       : 2351     |*                                       |
      1024 -> 2047       : 167      |                                        |
      2048 -> 4095       : 134      |                                        |
      4096 -> 8191       : 178      |                                        |
      8192 -> 16383      : 214      |                                        |
     16384 -> 32767      : 33       |                                        |
     32768 -> 65535      : 8        |                                        |
     65536 -> 131071     : 9        |                                        |
This shows that most of the blocking events were between 64 and 511 microseconds, which is consistent with flash storage I/O latency (this is a flash-based system). The slowest blocking events, while tracing, reached the 65 to 131 millisecond second range (the last bucket in this histogram).
What does this off-CPU time consist of? Everything from when a thread blocked to when it began running again, including scheduler delay.
At the time of writing this, cpudist uses kprobes (kernel dynamic tracing) to instrument the finish_task_switch() kernel function. (It should use the sched tracepoint, for API stability reasons, but the first attempt wasn't successful and was reverted for now.)
The prototype for finish_task_switch() is:
static struct rq *finish_task_switch(struct task_struct *prev)
To give you an idea of how this tool works: The finish_task_switch() function is called in the context of the next-running thread. An eBPF program can instrument this function and argument using kprobes, fetch the current PID (via bpf_get_current_pid_tgid()), and also fetch a high resolution timestamp (bpf_ktime_get_ns()). This is all the information needed for the above summary, which uses an eBPF map to efficiently store the histogram buckets in kernel context. Here is the full source to cpudist.
eBPF is not the only tool on Linux for measuring off-CPU time. The perf tool provides a "wait time" column in its perf sched timehist output, which excludes scheduler time as it's shown in the adjacent column separately. That output shows the wait time for each scheduler event, and costs more overhead to measure than the eBPF histogram summary.
Measuring off-CPU times as a histogram is a little bit useful, but not a lot. What we really want to know is context – why are threads blocking and going off-CPU. This is the focus of off-CPU analysis.
Off-CPU Analysis
Off-CPU analysis is the methodology of analyzing off-CPU time along with stack traces to identify the reason that threads were blocking. The off-CPU tracing analysis technique can be easy to implement due to this principle:
Application stack traces don't change while off-CPU.
This means we only need to measure the stack trace once, either at the beginning or end of the off-CPU period. The end is usually easier, since you're recording the time interval then anyway. Here is tracing pseudocode for measuring off-CPU time with stack traces:
on context switch finish:
	sleeptime[prev_thread_id] = timestamp
	if !sleeptime[thread_id]
		return
	delta = timestamp - sleeptime[thread_id]
	totaltime[pid, execname, user stack, kernel stack] += delta
	sleeptime[thread_id] = 0

on tracer exit:
	for each key in totaltime:
		print key
		print totaltime[key]
Some notes on this: all measurements happen from one instrumentation point, the end of the context switch routine, which is in the context of the next thread (eg, the Linux finish_task_switch() function). That way, we can calculate the off-CPU duration at the same time as retrieving the context for that duration by simply fetching the current context (pid, execname, user stack, kernel stack), which tracers make easy.
This is what my offcputime bcc/eBPF program does, which needs at least Linux 4.8 to work. I'll demonstrate using bcc/eBPF offcputime to measure blocking stacks for the tar program. I'll restrict this to kernel stacks only to start with (-K):
# /usr/share/bcc/tools/offcputime -K -p `pgrep -nx tar`
Tracing off-CPU time (us) of PID 15342 by kernel stack... Hit Ctrl-C to end.
^C
[...]

    finish_task_switch
    __schedule
    schedule
    schedule_timeout
    __down
    down
    xfs_buf_lock
    _xfs_buf_find
    xfs_buf_get_map
    xfs_buf_read_map
    xfs_trans_read_buf_map
    xfs_da_read_buf
    xfs_dir3_block_read
    xfs_dir2_block_getdents
    xfs_readdir
    iterate_dir
    SyS_getdents
    entry_SYSCALL_64_fastpath
    -                tar (18235)
        203075

    finish_task_switch
    __schedule
    schedule
    schedule_timeout
    wait_for_completion
    xfs_buf_submit_wait
    xfs_buf_read_map
    xfs_trans_read_buf_map
    xfs_imap_to_bp
    xfs_iread
    xfs_iget
    xfs_lookup
    xfs_vn_lookup
    lookup_slow
    walk_component
    path_lookupat
    filename_lookup
    vfs_statx
    SYSC_newfstatat
    entry_SYSCALL_64_fastpath
    -                tar (18235)
        661626

    finish_task_switch
    __schedule
    schedule
    io_schedule
    generic_file_read_iter
    xfs_file_buffered_aio_read
    xfs_file_read_iter
    __vfs_read
    vfs_read
    SyS_read
    entry_SYSCALL_64_fastpath
    -                tar (18235)
        18413238
I've truncated the output to the last three stacks. The last, showing a total of 18.4 seconds of off-CPU time, is in the read syscall path ending up with io_schedule() – this is tar reading file contents, and blocking on disk I/O. The stack above it shows 662 milliseconds in a stat syscall, which also ends up waiting for storage I/O via xfs_buf_submit_wait(). The top stack, with a total of 203 milliseconds, appears to show tar blocking on locks while doing a getdents syscall (directory listing).
Interpreting these stack traces takes a little familiarity with the source code, which depends on how complex the application is and its language. The more you do this, the quicker you'll become, as you'll recognize the same functions and stacks.
I'll now include user-level stacks:
# /usr/share/bcc/tools/offcputime -p `pgrep -nx tar`
Tracing off-CPU time (us) of PID 18311 by user + kernel stack... Hit Ctrl-C to end.
[...]

    finish_task_switch
    __schedule
    schedule
    io_schedule
    generic_file_read_iter
    xfs_file_buffered_aio_read
    xfs_file_read_iter
    __vfs_read
    vfs_read
    SyS_read
    entry_SYSCALL_64_fastpath
    [unknown]
    -                tar.orig (30899)
        9125783
This didn't work: user-level stacks are just "[unknown]". The reason is that the default version of tar is compiled without frame pointers, and this version of bcc/eBPF needs them to walk stack traces. I wanted to show what this gotcha looks like in case you hit it as well.
I did fix tar's stacks (see Prerequisites earlier) to see what they looked like:
# /usr/share/bcc/tools/offcputime -p `pgrep -nx tar`
Tracing off-CPU time (us) of PID 18375 by user + kernel stack... Hit Ctrl-C to end.
[...]

    finish_task_switch
    __schedule
    schedule
    io_schedule
    generic_file_read_iter
    xfs_file_buffered_aio_read
    xfs_file_read_iter
    __vfs_read
    vfs_read
    SyS_read
    entry_SYSCALL_64_fastpath
    __read_nocancel
    dump_file0
    dump_file
    dump_dir0
    dump_dir
    dump_file0
    dump_file
    dump_dir0
    dump_dir
    dump_file0
    dump_file
    dump_dir0
    dump_dir
    dump_file0
    dump_file
    create_archive
    main
    __libc_start_main
    [unknown]
    -                tar (15113)
        426525
[...]
Ok, so it looks like tar has a recursive walk algorithm for the file system tree.
Those stack traces are great – it's showing why the application was blocking and waiting off-CPU, and how long for. This is exactly the sort of information I'm usually looking for. However, blocking stack traces aren't always so interesting, as sometimes you need to look for request-synchronous context.
Request-Synchronous Context
Applications that wait for work, like web servers with pools of threads waiting on a socket, present a challenge for off-CPU analysis: often most of the blocking time will be in stacks waiting for work, rather than doing work. This floods the output with stacks that aren't very interesting.
As an example of this phenomenon, here are off-CPU stacks for a MySQL server process that is doing nothing. Zero requests per second:
# /usr/share/bcc/tools/offcputime -p `pgrep -nx mysqld`
Tracing off-CPU time (us) of PID 29887 by user + kernel stack... Hit Ctrl-C to end.
^C
[...]

  finish_task_switch
    __schedule
    schedule
    do_nanosleep
    hrtimer_nanosleep
    sys_nanosleep
    entry_SYSCALL_64_fastpath
    __GI___nanosleep
    srv_master_thread
    start_thread
    -                mysqld (29908)
        3000333

    finish_task_switch
    __schedule
    schedule
    futex_wait_queue_me
    futex_wait
    do_futex
    sys_futex
    entry_SYSCALL_64_fastpath
    pthread_cond_timedwait@@GLIBC_2.3.2
    os_event::wait_time_low(unsigned long, long)
    srv_error_monitor_thread
    start_thread
    -                mysqld (29906)
        3000342

    finish_task_switch
    __schedule
    schedule
    read_events
    do_io_getevents
    SyS_io_getevents
    entry_SYSCALL_64_fastpath
    [unknown]
    LinuxAIOHandler::poll(fil_node_t**, void**, IORequest*)
    os_aio_handler(unsigned long, fil_node_t**, void**, IORequest*)
    fil_aio_wait(unsigned long)
    io_handler_thread
    start_thread
    -                mysqld (29896)
        3500863
[...]
Various threads are polling for work and other background tasks. These background stacks can dominate the output, even for a busy MySQL server. What I'm usually looking for is off-CPU time during a database query or command. That's the time that matters – the time that's hurting the end customer. To find those in the output, I need to hunt around for stacks in query context.
For example, now from a busy MySQL server:
# /usr/share/bcc/tools/offcputime -p `pgrep -nx mysqld`
Tracing off-CPU time (us) of PID 29887 by user + kernel stack... Hit Ctrl-C to end.
^C
[...]

   finish_task_switch
    __schedule
    schedule
    io_schedule
    wait_on_page_bit_common
    __filemap_fdatawait_range
    file_write_and_wait_range
    ext4_sync_file
    do_fsync
    SyS_fsync
    entry_SYSCALL_64_fastpath
    fsync
    log_write_up_to(unsigned long, bool)
    trx_commit_complete_for_mysql(trx_t*)
    [unknown]
    ha_commit_low(THD*, bool, bool)
    TC_LOG_DUMMY::commit(THD*, bool)
    ha_commit_trans(THD*, bool, bool)
    trans_commit_stmt(THD*)
    mysql_execute_command(THD*, bool)
    mysql_parse(THD*, Parser_state*)
    dispatch_command(THD*, COM_DATA const*, enum_server_command)
    do_command(THD*)
    handle_connection
    pfs_spawn_thread
    start_thread
    -                mysqld (13735)
        1086119

[...]
This stack identifies some time (latency) during a query. The do_command() -> mysql_execute_command() code path is a give away. I know this because I'm familiar with the code from all parts of this stack: MySQL and kernel internals.
You can imagine writing a simple text post-processor, that plucked out the stacks of interest based on some application-specific pattern matching. And that might work fine. There's another way, which is a little more efficient, although also requires application specifics: extending the tracing program to also instrument application requests (the do_command() function, in this MySQL server example), and to then only record off-CPU time if it occurred during the application request. I've done it before, it can help.
Caveats
The biggest caveat is the overhead of off-CPU analysis, as described earlier in the overhead section, followed by getting stack traces to work, which I summarized in the earlier Prerequisites section. There is also scheduler latency and involuntary context switches to be aware of, which I'll summarize here, and wakeup stacks which I'll discuss in a later section.
Scheduler Latency
Something that's missing from these stacks is if the off-CPU time includes time spent waiting on a CPU run queue. This time is known as scheduler latency, run queue latency, or dispatcher queue latency. If the CPUs are running at saturation, then any time a thread blocks, it may endure additional time waiting its turn on a CPU after being woken up. That time will be included in the off-CPU time.
You can use extra trace events to tease apart off-CPU time into time blocked vs scheduler latency, but in practice, CPU saturation is pretty easy to spot, so you are unlikely to be spending much time studying off-CPU time when you have a known CPU saturation issue to deal with.
Involuntary Context Switching
If you see user-level stack traces that don't make sense – that show no reason to be blocking and going off-CPU – it could be due to involuntary context switching. This often happens when the CPUs are saturated, and the kernel CPU scheduler gives threads turns on CPU, then kicks them off when they reach their time slice. The threads can be kicked off anytime, such as in the middle of a CPU heavy code-path, and the resulting off-CPU stack trace makes no sense.
Here is an example stack from offcputime that is likely an involuntary context switch:
# /usr/share/bcc/tools/offcputime -p `pgrep -nx mysqld`
Tracing off-CPU time (us) of PID 29887 by user + kernel stack... Hit Ctrl-C to end.
[...]

    finish_task_switch
    __schedule
    schedule
    exit_to_usermode_loop
    prepare_exit_to_usermode
    swapgs_restore_regs_and_return_to_usermode
    Item_func::type() const
    JOIN::make_join_plan()
    JOIN::optimize()
    st_select_lex::optimize(THD*)
    handle_query(THD*, LEX*, Query_result*, unsigned long long, unsigned long long)
    [unknown]
    mysql_execute_command(THD*, bool)
    Prepared_statement::execute(String*, bool)
    Prepared_statement::execute_loop(String*, bool, unsigned char*, unsigned char*)
    mysqld_stmt_execute(THD*, unsigned long, unsigned long, unsigned char*, unsigned long)
    dispatch_command(THD*, COM_DATA const*, enum_server_command)
    do_command(THD*)
    handle_connection
    pfs_spawn_thread
    start_thread
    -                mysqld (30022)
        13

[...]
It's not clear (based on the function names) why this thread blocked in Item_func::type(). I suspect this is an involuntary context switch, as the server was CPU saturated.
A workaround with offcputime is to filter on the TASK_UNINTERRUPTIBLE state (2):
# /usr/share/bcc/tools/offcputime -p `pgrep -nx mysqld` --state 2
On Linux, involuntary context switches occur for state TASK_RUNNING (0), whereas the blocking events we're usually interested in are in TASK_INTERRUPTIBLE (1) or TASK_UNINTERRUPTIBLE (2), which offcputime can match on using --state. I used this feature in my Linux Load Averages: Solving the Mystery post.
Flame Graphs
Flame Graphs are a visualization of profiled stack traces, and are very useful for quickly comprehending the hundreds of pages of stack trace output that can be generated by off-CPU analysis. Yichun Zhang first created off-CPU time flame graphs, using SystemTap.
The offcputime tool has a -f option for emitting stack traces in "folded format": semi-colon delimited on one line, followed by the metric. This is the format that my FlameGraph software takes as input.
For example, creating an off-CPU flame graph for mysqld:
# /usr/share/bcc/tools/offcputime -df -p `pgrep -nx mysqld` 30 > out.stacks
[...copy out.stacks to your local system if desired...]
# git clone https://github.com/brendangregg/FlameGraph
# cd FlameGraph
# ./flamegraph.pl --color=io --title="Off-CPU Time Flame Graph" --countname=us < out.stacks > out.svg
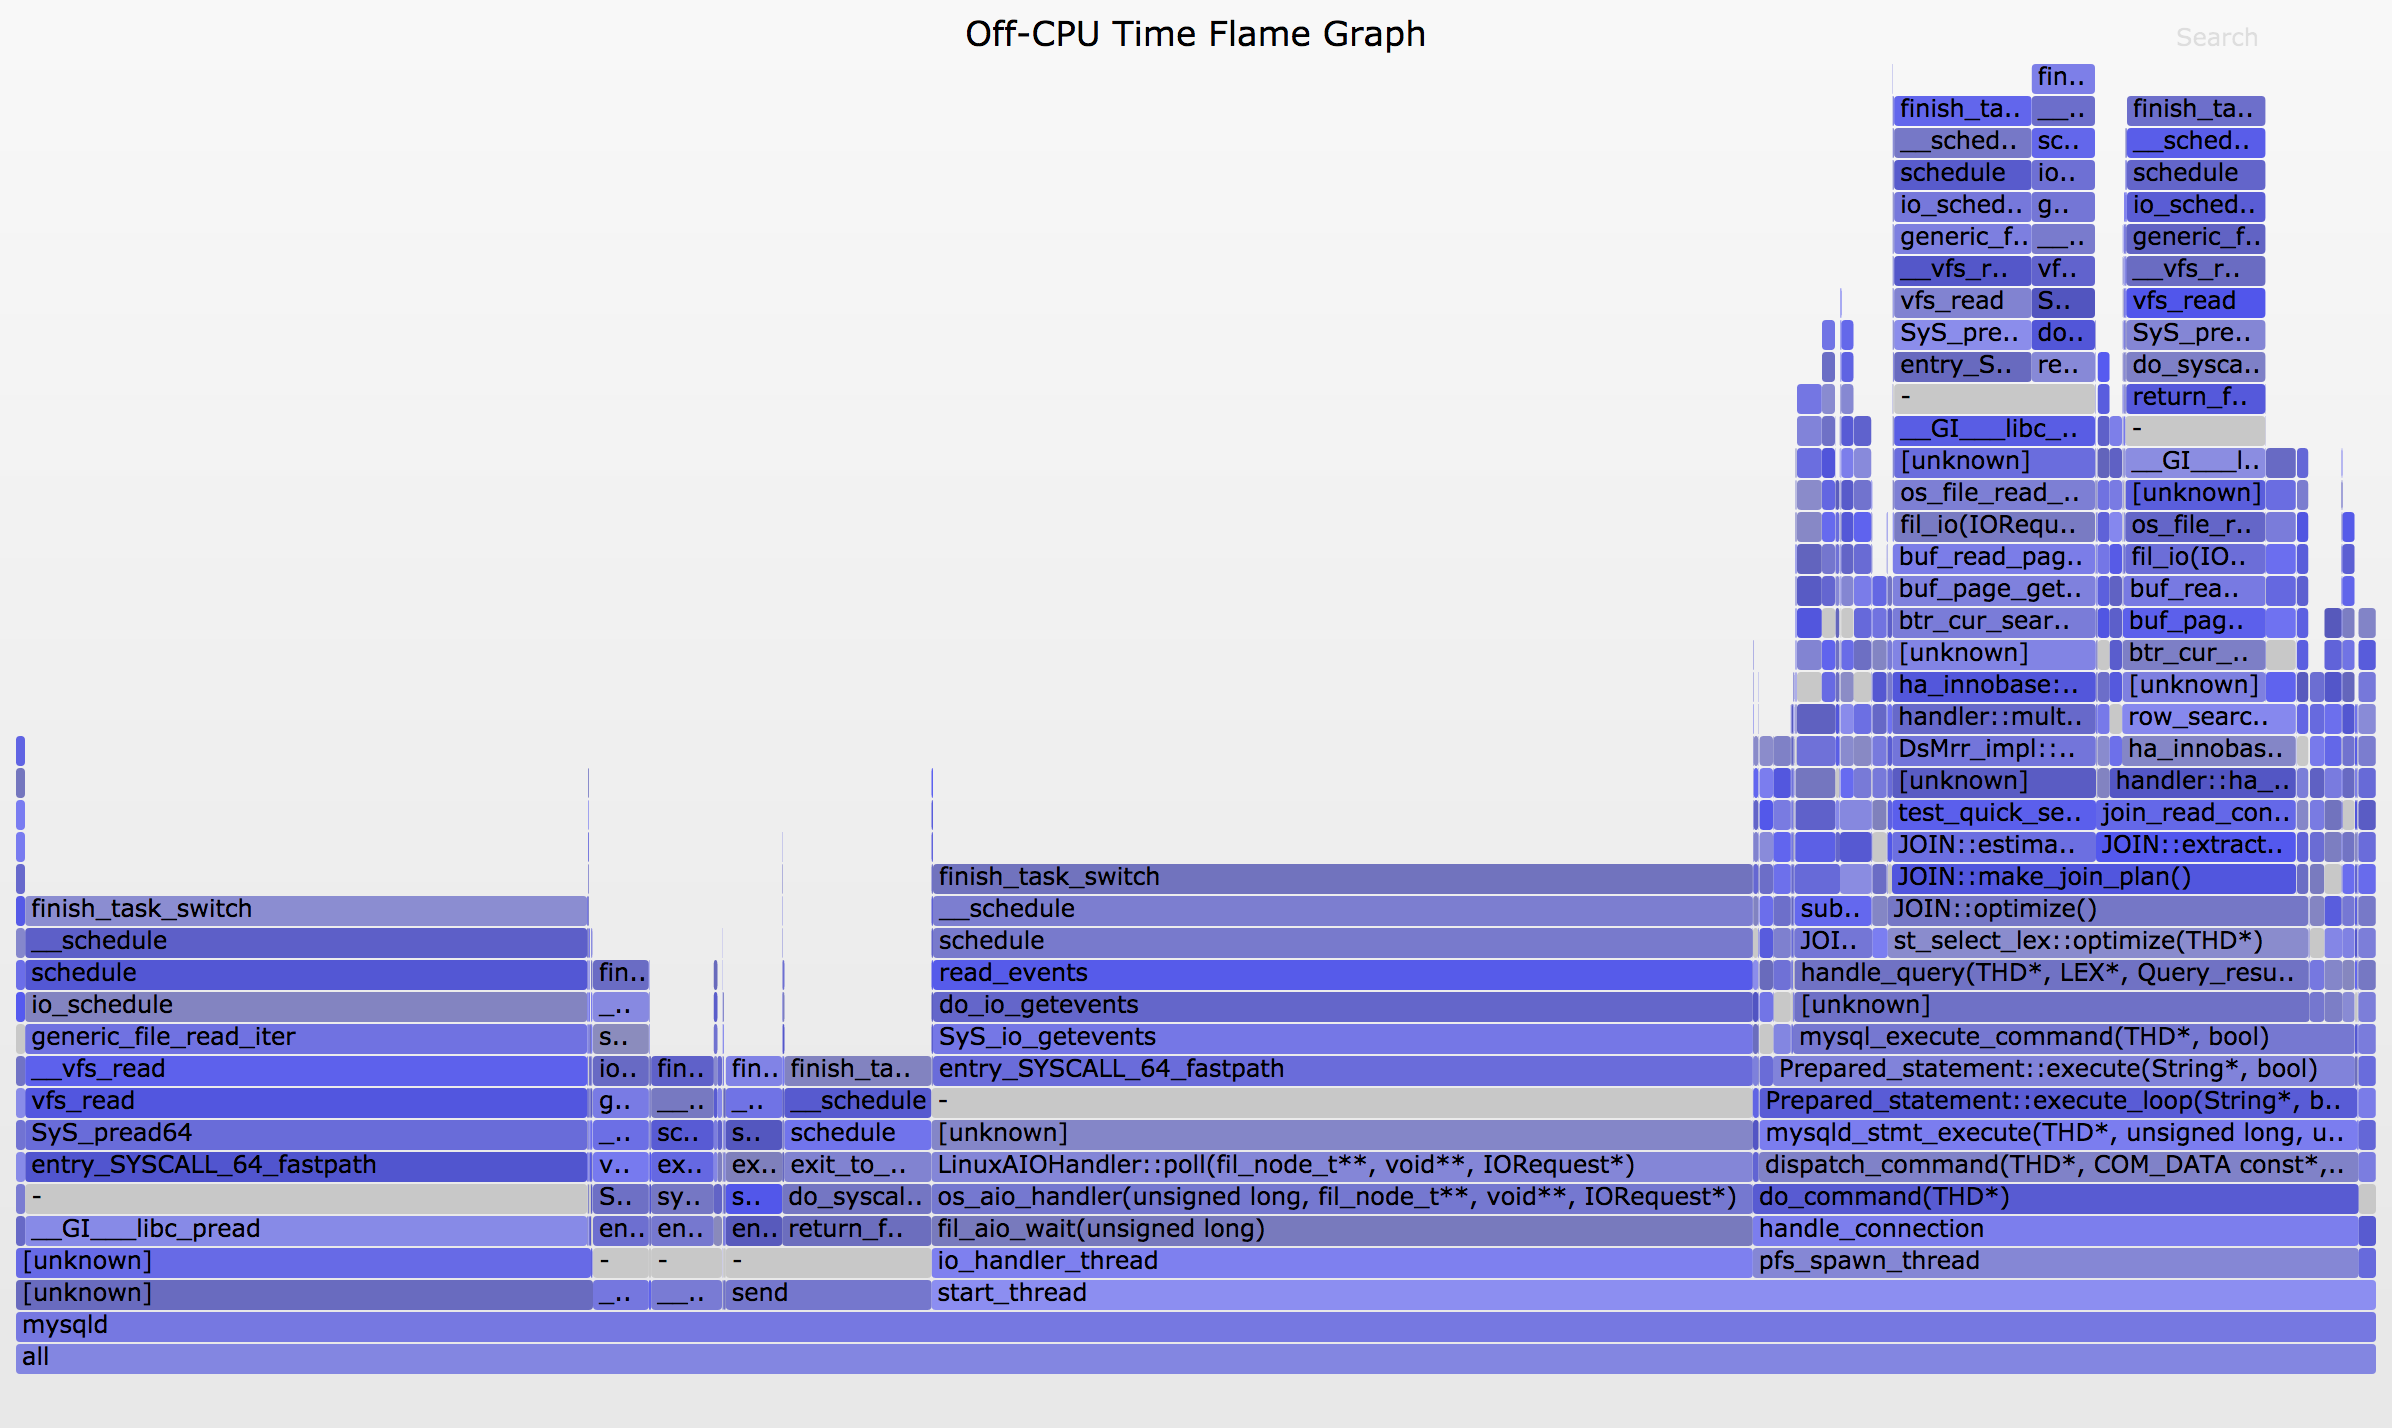
Then open out.svg in a web browser. It looks like this (SVG, PNG):
Much better: this shows all off-CPU stack traces, with stack depth on the y-axis, and the width corresponds to the total time in each stack. The left-to-right ordering has no meaning. There are delimiter frames "-" between the kernel and user stacks, which were inserted by offcputime's -d option.
You can click to zoom. For example, click on the "do_command(THD*)" frame on the right bottom, to zoom into the blocking paths that happened during a query. You might want to generate flame graphs which only show these paths, which can be as simple as grep, since the folded format is one line per stack:
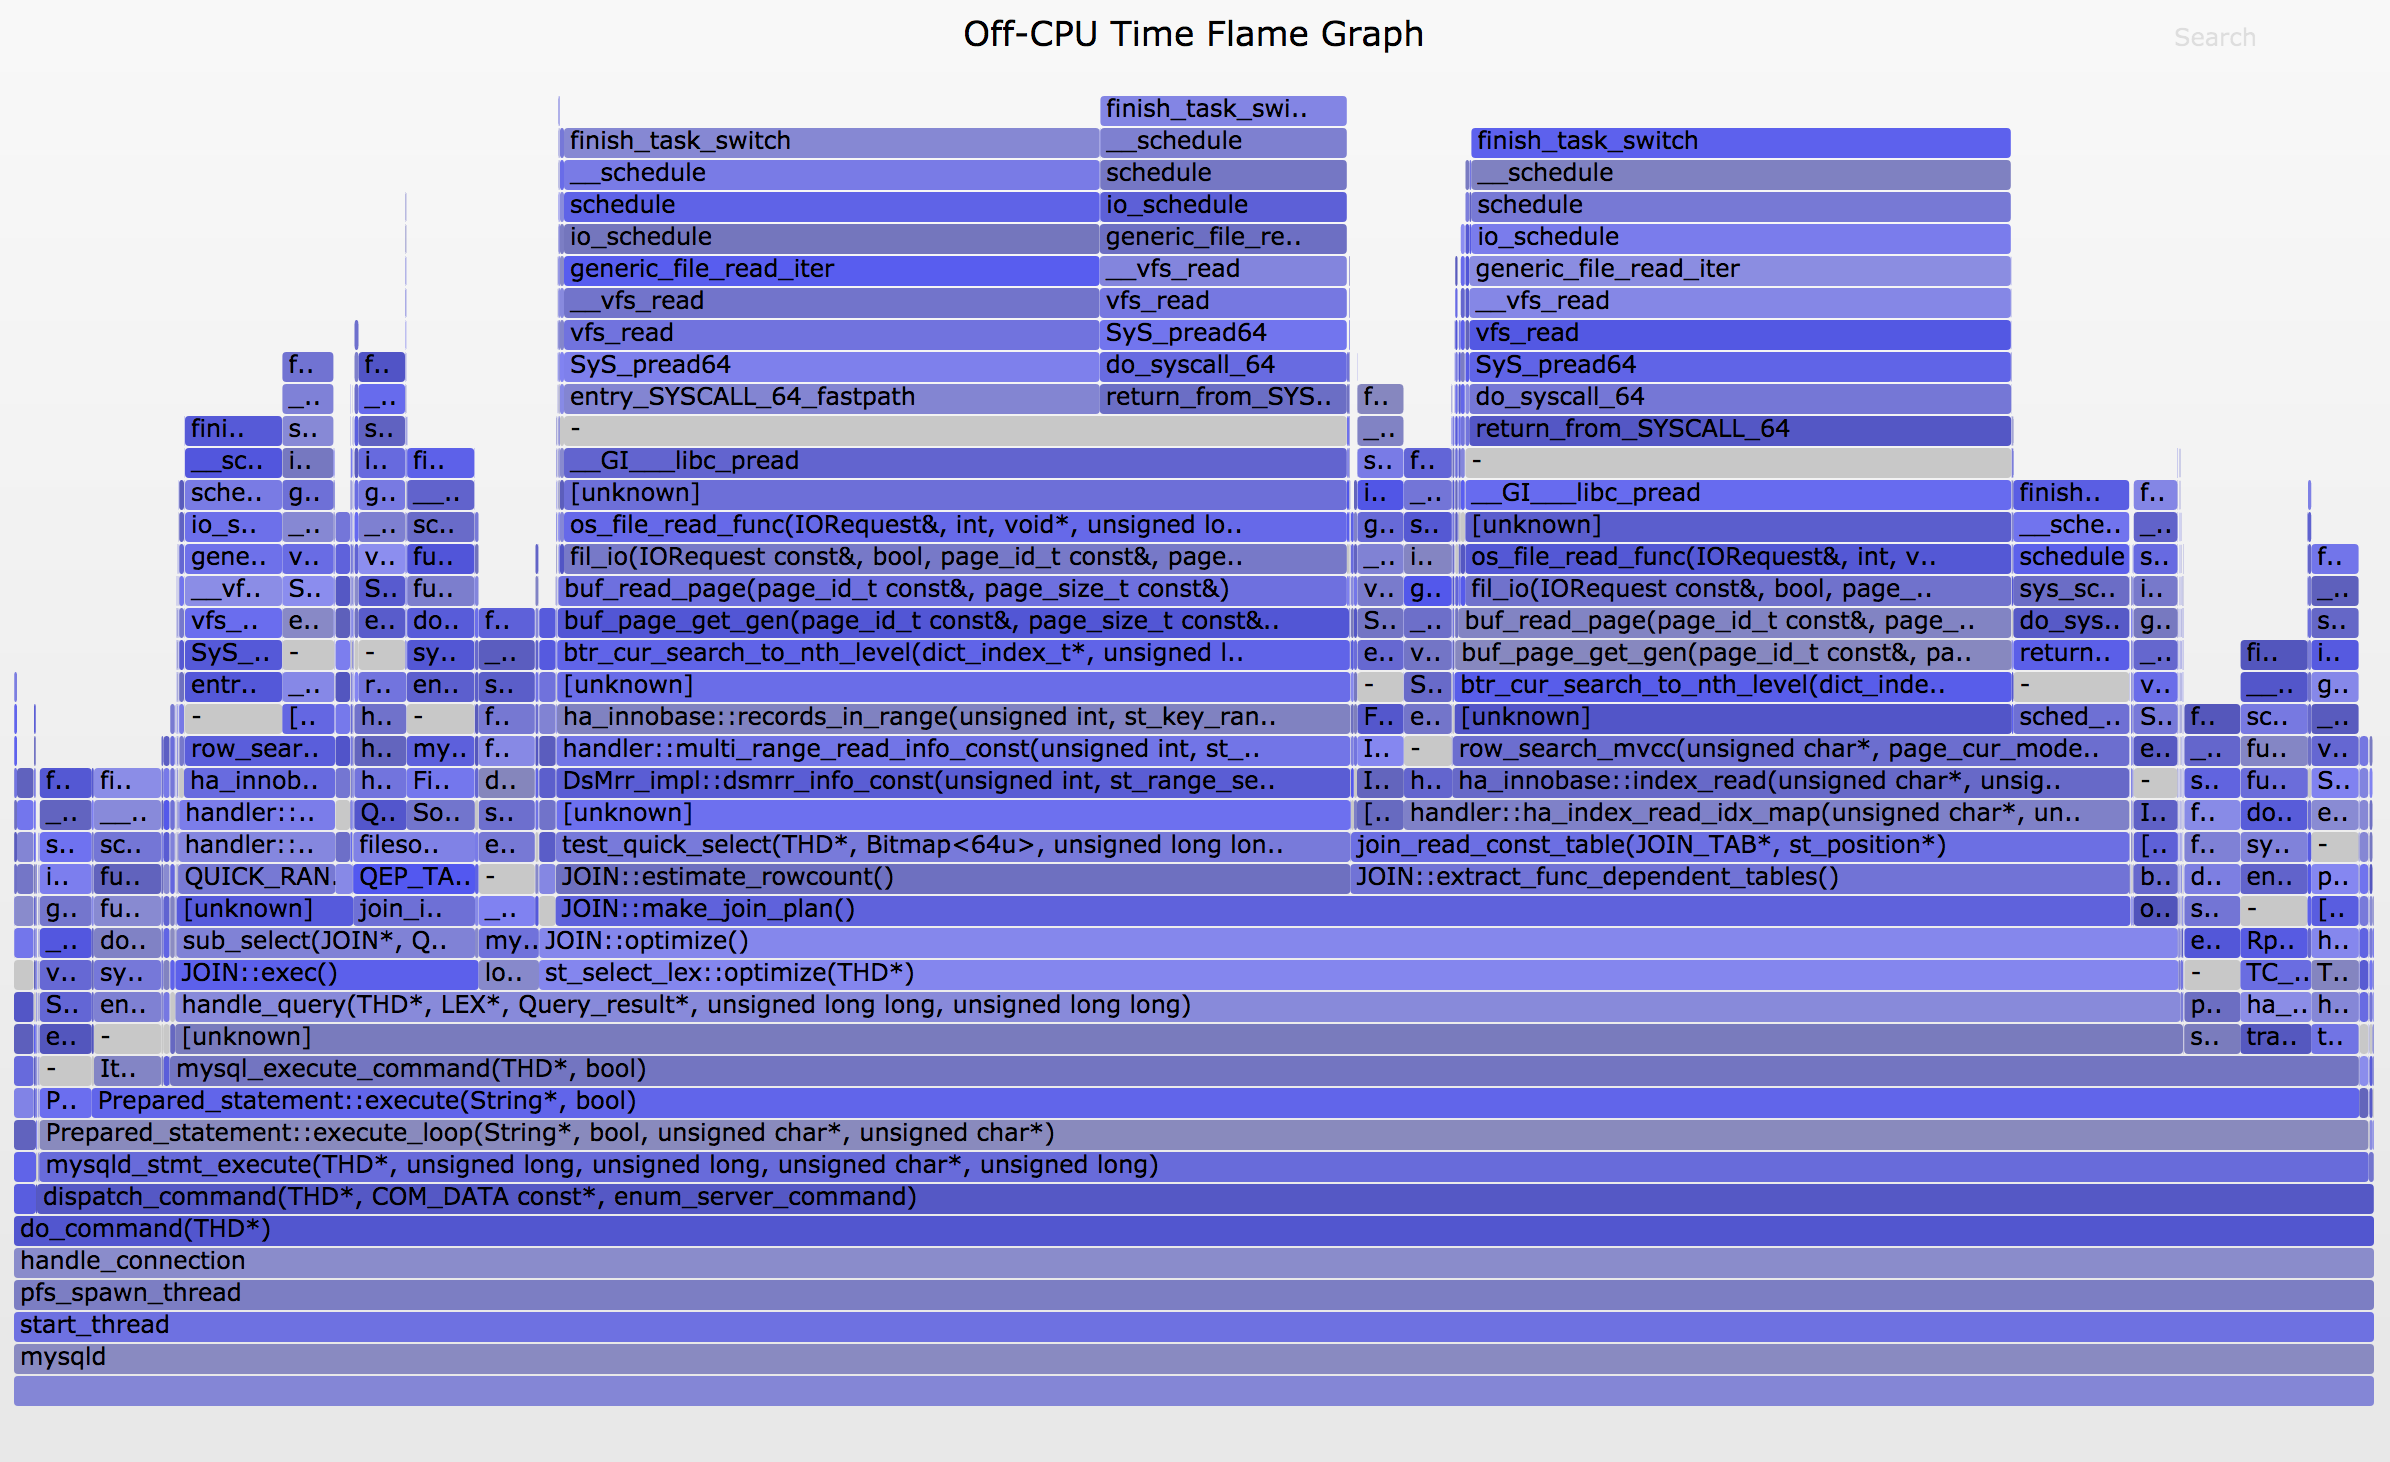
# grep do_command < out.stacks | ./flamegraph.pl --color=io --title="Off-CPU Time Flame Graph" --countname=us > out.svg
The resulting flame graph (SVG, PNG):
That looks great.
For more on off-CPU flame graphs, see my Off-CPU Flame Graphs page.
Wakeups
Now that you know how to do off-CPU tracing, and generate flame graphs, you're starting to really look at these flame graphs and interpret them. You may find that many off-CPU stacks show the blocking path, but not the full reason it was blocked. That reason and code path is with another thread, the one that called a wakeup on a blocked thread. This happens all the time.
I cover this topic in my Off-CPU Flame Graphs page, along with two tools: wakeuptime and offwaketime, to measure wakeup stacks and also to associate them with off-CPU stacks.
Other Operating Systems
- Solaris: DTrace can be used for off-cpu tracing. Here is my original page on this: Solaris Off-CPU Analysis.
- FreeBSD: Off-CPU analysis can be performed using procstat -ka for kernel-stack sampling, and DTrace for user- and kernel-stack tracing. I've created a separate page for this: FreeBSD Off-CPU Analysis.
Origin
I started using this methodology in about 2005 after exploring uses of the DTrace sched provider and its sched:::off-cpu probe. I called it off-CPU analysis and the metric off-CPU time, after the DTrace probe name (not a perfect name: when teaching a DTrace class in Adelaide in 2005, a Sun engineer said I shouldn't call it off-CPU since the CPU isn't "off"). The Solaris Dynamic Tracing Guide had some examples of measuring the time from sched:::off-cpu to sched:::on-cpu for some specific cases and process states. I didn't filter on process state, and instead captured all off-CPU events, and included the stack trace to explain why. I think this approach is obvious, so I doubt I'm the first to do this, but I seem to have been the only person really promoting this methodology for a while. I wrote about it in 2007 in DTracing Off-CPU Time, and in later posts and talks.
Summary
Off-CPU analysis can be an effective way to locate types of latency where threads block and wait for some other event. By tracing this from the kernel scheduler functions that context switch threads, all off-CPU latency types can be analyzed in the same way, without needing to trace multiple sources. To see the context for the off-CPU event to understand why it occurred, both user and kernel stack back traces can be inspected.
With CPU profiling and off-CPU analysis, you have the full picture of where threads spend their time. These are complementary techniques.
For more on off-CPU analysis, see the visualizations in Off-CPU Flame Graphs and Hot/Cold Flame Graphs.
Updates
My first post on off-CPU analysis was in 2007: DTracing Off-CPU Time.
Updates from 2012:
- I included off-CPU analysis as a part of a Stack Profile Method in my USENIX LISA 2012 talk. The Stack Profile Method is the technique of collecting both CPU and off-CPU stacks, to study all the time spent by threads.
Updates from 2013:
- Yichun Zhang created off-CPU flame graphs using SystemTap and gave the talk Introduction to off CPU Time Flame Graphs (PDF).
- I included off-CPU flame graphs in my USENIX LISA 2013 talk Blazing Performance with Flame Graphs.
Updates from 2015:
- I posted FreeBSD Off-CPU Flame Graphs to explore the procstat -ka off-CPU sampling approach.
- I posted Linux perf_events Off-CPU Time Flame Graph to show how these could be created with perf event logging – if all you had was perf (use eBPF instead).
Updates from 2016:
- I posted Linux eBPF Off-CPU Flame Graph to show the value of this and help make the case for stack traces in eBPF (I had to hack them in for this proof of concept).
- I posted Linux Wakeup and Off-Wake Profiling to show wakeup stack analysis.
- I posted Who is waking the waker? (Linux chain graph prototype as a proof of concept of walking a chain of wakeups.
- I described the importance of off-CPU analysis at the start of my Facebook Performance@Scale talk: Linux BPF Superpowers (slides).
Updates from 2017:
- I used a few off-CPU flame graphs in my Linux Load Averages: Solving the Mystery post.
- I summarized off-CPU, wakeup, off-wake, and chain graphs in my USENIX ATC 2017 talk on Flame Graphs: youtube, slides.