Working Set Size Estimation
The Working Set Size (WSS) is how much memory an application needs to keep working. Your application may have 100 Gbytes of main memory allocated and page mapped, but it is only touching 50 Mbytes each second to do its job. That's the working set size: the "hot" memory that is frequently used. It is useful to know for capacity planning and scalability analysis.
You may never have seen WSS measured by any tool (when I created this page, I hadn't either). OSes usually show you these metrics:
- Virtual memory: Not real memory. It's an artifact of a virtual memory system. For on-demand memory systems like Linux, malloc() immediately returns virtual memory, which is only promoted to real memory later when used (promoted via a page fault).
- Resident memory or Resident set size (RSS): Main memory. Real memory pages that are currently mapped.
- Proportional set size (PSS): RSS with shared memory divided among users.
These are easily tracked by the kernel as it manages virtual and main memory allocation. But when your application is in user-mode doing load and store instructions across its WSS, the kernel isn't (usually) involved. So there's no obvious way a kernel can provide a WSS metric.
On this page I'll summarize WSS objectives and different approaches for WSS estimation, applicable to any OS. This includes my wss tools for Linux, which do page-based WSS estimation by use of referenced and idle page flags, and my WSS profile charts.
Table of contents:
- Estimation
- Observation: Paging/Swapping Metrics
- Experimentation: Main Memory Shrinking
- Observation: PMCs
- Experimentation: CPU Cache Flushing
- Experimentation: PTE Accessed bit
- Experimentation: MMU Invalidation
Objectives
What you intend to use WSS for will direct how you measure it. Consider these three scenarios:
A) You are sizing main memory for an application, with the intent to keep it from paging (swapping). WSS will be measured in bytes over a long interval, say, one minute.
B) You are optimizing CPU caches. WSS will be measured in unique cachelines accessed over a short interval, say, one second or less. The cacheline size is architecture dependent, usually 64 bytes.
C) You are optimizing the TLB caches (translation lookaside buffer: a memory management unit cache for virtual to physical translation). WSS will be measured in unique pages accessed over a short interval, say, one second or less. The pagesize is architecture and OS configuration dependent, 4 Kbytes is commonly used.
You can figure out the cacheline size on Linux using cpuid, and the page size using pmap -XX.
1. Estimation
You can try estimating it: how much memory would your application touch to service a request, or over a short time interval? If you have access to the developer of the application, they may already have a reasonable idea. Depending on your objective, you'll need to ask either how many unique bytes, cachelines, or pages would be referenced.
2. Observation: Paging/Swapping Metrics
Paging metrics are commonly available across different operating systems. Linux, BSD, and other Unixes print them in vmstat, OS X in vm_stat. There are usually also scanning metrics, showing that the system is running low on memory and is spending more time keeping free lists populated.
The basic idea with these metrics is:
- Sustained paging/swapping == WSS is larger than main memory.
- No paging/swapping, but sustained scanning == WSS is close to main memory size.
- No paging/swapping or scanning == WSS is lower than main memory size.
What's interesting about sustained paging, as opposed to other memory counters (like resident memory aka RSS: resident set size, virtual memory, Linux "active"/"inactive" memory, etc), is that the sustained page-ins tell us that the application is actually using that memory to do its job. With counters like resident set size (RSS), you don't know how much of that the application is actually using each second.
On Linux, this requires a swap device to be configured as the target for paging, which on many systems is not the case. Without a swap device, the Linux out-of-memory (OOM) killer can kill sacrificial processes to free space, which doesn't tell us a great deal about WSS.
2.1. Paging/Swapping
Finding paging/swapping counters is usually easy. Here they are on Linux (output columns don't line up with the header):
# vmstat 1
procs -----------memory---------- ---swap-- -----io---- -system-- ------cpu-----
 r  b   swpd   free   buff  cache   si   so    bi    bo   in   cs us sy id wa st
 1  1      0 64166788  36348 5396380    0    0     0     1    1    1  9  0 91  0  0
 0  1      0 64166656  36348 5396388    0    0     0 18432  318  510  0  0 97  3  0
 0  1      0 64167276  36348 5396356    0    0     0 21504  359  551  0  0 97  3  0
[...]
Linux calls paging "swapping" (in other Unixes, swapping refers to moving entire threads to the swap device, and paging refers to just the pages). The above example shows no swapping is active.
2.2. Scanning
Older Unixes used a page scanner to search all memory for not-recently-used pages for paging out, and reported a scan rate in vmstat. The scan rate was only non-zero when the system was running out of memory, and increased based on demand. That scan rate could be used as an early warning that the system was about to run out of main memory (if it wasn't paging already), and the rate as the magnitude. Note that it needs to be sustained scanning (e.g., 30 seconds) to give an indication about WSS. An application could allocate and populate memory that was scanned and paged out, but then not used again, causing a burst in scanning and paging. That's cold memory: it's not WSS. WSS is active, and if paged out will be quickly paged back in again, causing paging churn: sustained scanning and paging.
Linux maintains "active" and "inactive" lists of memory, so that eligible pages can be found quickly by walking the inactive list. At various points in time, pages will be moved from an active list to an inactive list, where they have a chance to be "reclaimed" and moved back to active, before swapped out when needed. Active/inactive memory sizes are available in /proc/meminfo. To check if the system is getting close to the swapping point, the vmscan tracepouints can be used. Eg:
# perf stat -e 'vmscan:*' -a
^C
 Performance counter stats for 'system wide':

                 1      vmscan:mm_vmscan_kswapd_sleep
                16      vmscan:mm_vmscan_kswapd_wake
                 8      vmscan:mm_vmscan_wakeup_kswapd
                 4      vmscan:mm_vmscan_direct_reclaim_begin
                 0      vmscan:mm_vmscan_memcg_reclaim_begin
                 0      vmscan:mm_vmscan_memcg_softlimit_reclaim_begin
                 4      vmscan:mm_vmscan_direct_reclaim_end
                 0      vmscan:mm_vmscan_memcg_reclaim_end
                 0      vmscan:mm_vmscan_memcg_softlimit_reclaim_end
             1,407      vmscan:mm_shrink_slab_start
             1,407      vmscan:mm_shrink_slab_end
            10,280      vmscan:mm_vmscan_lru_isolate
                 0      vmscan:mm_vmscan_writepage
             8,567      vmscan:mm_vmscan_lru_shrink_inactive
             1,713      vmscan:mm_vmscan_lru_shrink_active
             2,743      vmscan:mm_vmscan_inactive_list_is_low
You could choose just the vmscan:mm_vmscan_kswapd_wake tracepoint as a low-overhead (because it is low frequency) indicator. Measuring it per-second:
# perf stat -e vmscan:mm_vmscan_kswapd_wake -I 1000 -a
#           time             counts unit events
     1.003586606                  0      vmscan:mm_vmscan_kswapd_wake
     2.013601131                  0      vmscan:mm_vmscan_kswapd_wake
     3.023623081                  0      vmscan:mm_vmscan_kswapd_wake
     4.033634433                 30      vmscan:mm_vmscan_kswapd_wake
     5.043653518                 24      vmscan:mm_vmscan_kswapd_wake
     6.053670317                  0      vmscan:mm_vmscan_kswapd_wake
     7.063690060                  0      vmscan:mm_vmscan_kswapd_wake
You may also see kswapd show up in process monitors, consuming %CPU.
3. Experimentation: Main Memory Shrinking
Worth mentioning but not recommended: I saw this approach used many years ago on Unix systems where paging was more commonly configured and used, and one could experimentally reduce the memory available to a running application while watching how heavily it was paging. There'd be a point where the application was generally "happy" (low paging), and then where it wasn't (suddenly high paging). That point is a measure of WSS.
4. Observation: PMCs
Performance Monitoring Counters (PMCs) can provide some clues to your WSS, and can be measured on Linux using perf. Here's a couple of workloads, measured using my pmcarch tool from pmc-cloud-tools:
workload_A# ./pmcarch
K_CYCLES   K_INSTR      IPC BR_RETIRED   BR_MISPRED  BMR% LLCREF      LLCMISS     LLC%
3062544    4218774     1.38 498585136    540218      0.11 455116420   680676     99.85
3053808    4217232     1.38 499144330    524938      0.11 454770567   667970     99.85
3132681    4259505     1.36 515882929    680336      0.13 457656727   980983     99.79
[...]

workload_B# ./pmcarch
K_CYCLES   K_INSTR      IPC BR_RETIRED   BR_MISPRED  BMR% LLCREF      LLCMISS     LLC%
3079239    2314148     0.75 273159770    512862      0.19 243202555   148518182  38.93
3079912    2308655     0.75 273788704    494820      0.18 245159935   149093401  39.19
3090707    2316591     0.75 274770578    523050      0.19 243819132   148390054  39.14
[...]
Workload A has a Last Level Cache (LLC, aka L3) hit ratio of over 99.8%. Might its WSS be smaller than the LLC size? Probably. The LLC size is 24 Mbytes (the CPU is: Intel(R) Xeon(R) Platinum 8124M CPU @ 3.00GHz). This is a synthetic workload with a uniform access distribution, where I know the WSS is 10 Mbytes.
Workload B has a LLC hit ratio of 39%. Not really fitting at all. It's also synthetic and uniform, with a WSS of 100 Mbytes, bigger than the LLC. So that makes sense.
How about this?
workload_B# ./pmcarch
K_CYCLES   K_INSTR      IPC BR_RETIRED   BR_MISPRED  BMR% LLCREF      LLCMISS     LLC%
3076373    6509695     2.12 931282340    620013      0.07 8408422     3273774    61.07
3086379    6458025     2.09 926621170    616174      0.07 11152959    4388135    60.65
3094250    6487365     2.10 932153872    629623      0.07 8865611     3402170    61.63
With a 61% LLC hit ratio, you might guess it is somewhere in-between workload A (10 Mbytes) and B (100 Mbytes). But no, this is also 100 Mbytes. I elevated its LLC hit ratio by making the access pattern non-uniform. What can we do about that? There are a lot of PMCs: for caches, the MMU and TLB, and memory events, so I think it's possible that we could model a CPU, plug in all these numbers, and have it estimate not just the WSS but also the access pattern. I haven't seen anyone try this (surely someone has), so I don't have any reference about it. It's been on my todo list to try for a while. It also involves truly understanding each PMC: they often have measurement caveats.
Here's a screenshot of cpucache, a new tool I just added to pmc-cloud-tools, which shows some of these additional PMCs:
# ./cpucache
All counter columns are x 1000
CYCLES     INSTR        IPC L1DREF    L1DMISS    L1D% L2REF    L2MISS     L2% LLCREF   LLCMISS   LLC%
13652088   5959020     0.44 1552983   12993     99.16 19437    8512     56.20 10224    4306     57.88
7074768    5836783     0.83 1521268   12965     99.15 21182    10380    51.00 13081    4213     67.79
7065207    5826542     0.82 1520193   12905     99.15 19397    8612     55.60 10319    4118     60.09
[...]
Note that CPU caches usually operate on cachelines (e.g., 64 bytes), so a workload of random 1 byte reads becomes 64 byte reads, inflating the WSS. Although, if I'm analyzing CPU cache scalability, I want to know the WSS in terms of cachelines anyway, as that's what will be cached.
At the very least, PMCs can tell you this:
If the L1, L2, or LLC has a ~100% hit ratio and a high ref count, then a single-threaded cacheline-based WSS is smaller than that cache, and might be bigger than any before it.
If the L2 was 8 Mbytes, the LLC was 24 Mbytes, and the LLC had a ~100% hit ratio and a high reference count, you might conclude that the WSS is between 8 and 24 Mbytes. If it was smaller than 8 Mbytes, then it would fit in the L2, and the LLC would no longer have a high reference count. I said "might be" because a smaller workload might not cache in the L2 for other reasons: e.g., set associativity.
I also had to qualify this as single-threaded. What's wrong with multi-threaded? Consider a multi-core multi-socket server running a multi-threaded application, where each thread has effectively its own working set it is operating on. The application's combined working set size can be cached by multiple CPU caches: multiple L1, L2, and LLCs. It may have a ~100% LLC hit ratio, but the WSS is bigger than a single LLC, because it is living in more than one.
5. Experimentation: CPU Cache Flushing
Just an idea. I couldn't find an example of anyone doing it, but for CPU caches I imagine cache flushing combined with PMCs can be used for WSS estimation. Flush the cache, then measure how quickly it takes for the LLC to fill and begin evicting again. The slower it takes, the smaller the WSS (probably). There's usually CPU instructions to help with cache flushing, provided they are enabled:
# cpuid -1 | grep -i flush
      CLFLUSH line size              = 0x8 (8)
      CLFLUSH instruction                    = true
      CLFLUSHOPT instruction                   = true
There's also other caches this approach can be applied to. The MMU TLB can be flushed (at least, the kernel knows how). The Linux file system cache can be flushed with /proc/sys/vm/drop_caches, and then growth tracked over time via OS metrics (e.g., free).
6. Experimentation: PTE Accessed Bit
These approaches make use of a page table entry (PTE) "Accessed" bit, which is normally updated by the CPU MMU as it accesses memory pages, and can be read and cleared by the kernel. This can be used to provide a page-based WSS estimation by clearing the accessed bit on all of a process's pages, waiting an interval, and then checking how many pages the bit returned to. It has the advantage of no extra overhead when the accessed bit is updated, as the MMU does it anyway.
6.1. Linux Reference Page Flag
This uses a kernel feature added in Linux 2.6.22: the ability to set and read the referenced page flag from user space, added for analyzing memory usage. The referenced page flag is really the PTE accessed bit (_PAGE_BIT_ACCESSED in Linux). I developed wss.pl as a front-end to this feature. The following uses it on a MySQL database server (mysqld), PID 423, and measures its working set size for 0.1 seconds (100 milliseconds):
# ./wss.pl 423 0.1
Watching PID 423 page references during 0.1 seconds...
Est(s)     RSS(MB)    PSS(MB)    Ref(MB)
0.107       403.66     400.59      28.02
In 100 ms, mysqld touched 28 Mbytes worth of pages, out of its 404 Mbytes of total main memory. Why did I use a 100 ms interval? Short durations can be useful for understanding how well a WSS will fit into the CPU caches (L1/L2/L3, TLB L1/L2, etc). In this case, 28 Mbytes is a little larger than the LLC for this CPU, so may not cache so well (in a single LLC, anyway).
The columns printed here are:
- Est(s): Estimated WSS measurement duration: this accounts for delays with setting and reading pagemap data.
- RSS(MB): Resident Set Size (Mbytes). The main memory size.
- PSS(MB): Proportional Set Size (Mbytes). Accounting for shared pages.
- Ref(MB): Referenced (Mbytes) during the specified duration. This is the working set size metric.
I'll cover estimated duration more in section 6.7.
6.1.1. How it works
It works by resetting the referenced flag on memory pages, and then checking later to see how many pages this flag returned to. I'm reminded of the old Unix page scanner, which would use a similar approach to find not-recently-used pages that are eligible for paging to the swap device (aka swapping). My tool uses /proc/PID/clear_refs and the Referenced value from /proc/PID/smaps, which were added in 2007 by David Rientjes. He also described memory footprint estimation in his patch. I've only seen one other description of this feature: How much memory am I really using?, by Jonathan Corbet (lwn.net editor). I'd categorize this as an experimental approach, as it modifies the state of the system: changing referenced page flags.
My previous PMC analysis rounded the WSS up to the cacheline size (e.g., 64 bytes). This approach rounds it up to the pagesize (e.g., 4 Kbytes), so is likely to show you a worst-case WSS. With huge pages, a 2 Mbyte pagesize, it might inflate WSS too much beyond reality. However, sometimes a pagesize-based WSS is exactly what you want anyway: understanding TLB hit ratios, which stores page mappings.
6.1.2. WARNINGs
This tool uses /proc/PID/clear_refs and /proc/PID/smaps, which can cause slightly higher application latency (e.g., 10%) while the kernel walks page structures. For large processes (> 100 Gbytes) this duration of higher latency can last over 1 second, during which this tool is consuming system CPU time. Consider these overheads. This also resets the referenced flag, which might confuse the kernel as to which pages to reclaim, especially if swapping is active. This also activates some old kernel code that may not have been used in your environment before, and which modifies page flags: I'd guess there is a risk of an undiscovered kernel panic (the Linux mm community may be able to say how real this risk is). Test in a lab environment for your kernel versions, and consider this experimental: use at your on risk.
See the section 7 for a somewhat safer approach using the idle page flag on Linux 4.3+, which also tracks unmapped file I/O memory.
6.1.3. Cumulative growth
Here's the same process, but measuring WSS for 1, 10, and 60 seconds (which costs no extra overhead, as the tool sleeps for the duration anyway):
# ./wss.pl `pgrep -n mysqld` 1
Watching PID 423 page references during 1 seconds...
Est(s)     RSS(MB)    PSS(MB)    Ref(MB)
1.012       403.66     400.75      69.44

# ./wss.pl `pgrep -n mysqld` 10
Watching PID 423 page references during 10 seconds...
Est(s)     RSS(MB)    PSS(MB)    Ref(MB)
10.019      403.66     400.75      80.79

# ./wss.pl `pgrep -n mysqld` 60
Watching PID 423 page references during 60 seconds...
Est(s)     RSS(MB)    PSS(MB)    Ref(MB)
60.068      403.66     400.60      84.50
After one second this process has referenced 69 Mbytes, and after ten seconds 81 Mbytes, showing that much of the WSS was already referenced in the first second.
This tool has a cumulative mode (-C), where it will produce rolling output showing how the working set grows. This works by only resetting the referenced flag once, at the start, and then for each interval printing the currently referenced size. Showing a rolling one-second output:
# ./wss -C `pgrep -n mysqld` 1
Watching PID 423 page references grow, output every 1 seconds...
Est(s)     RSS(MB)    PSS(MB)    Ref(MB)
1.014       403.66     400.59      86.00
2.034       403.66     400.59      90.75
3.054       403.66     400.59      94.29
4.074       403.66     400.59      97.53
5.094       403.66     400.59     100.33
6.114       403.66     400.59     102.44
7.134       403.66     400.59     104.58
8.154       403.66     400.59     106.31
9.174       403.66     400.59     107.76
10.194      403.66     400.59     109.14
[...]
6.1.4. Comparing to PMCs
As a test, I ran this on some MySQL sysbench OLTP workloads of increasing size. Here is --oltp-table-size=10000:
# ./wss.pl -C `pgrep -nx mysqld` 1
Watching PID 423 page references grow, output every 1 seconds...
Est(s)     RSS(MB)    PSS(MB)    Ref(MB)
1.014       403.66     400.77      12.46
2.033       403.66     400.77      12.64
3.043       403.66     400.77      12.70
4.053       403.66     400.77      12.79
5.063       403.66     400.77      12.88
6.073       403.66     400.77      12.98
[...]

# ./pmcarch
K_CYCLES   K_INSTR      IPC BR_RETIRED   BR_MISPRED  BMR% LLCREF      LLCMISS     LLC%
3924948    4900967     1.25 983842564    8299056     0.84 49012994    423312     99.14
3741509    4946034     1.32 984712358    8397732     0.85 47532624    476105     99.00
3737663    4903352     1.31 987003949    8219215     0.83 48084819    469919     99.02
3772954    4898714     1.30 980373867    8259970     0.84 47347470    445533     99.06
3762491    4915739     1.31 983279742    8320859     0.85 48034764    398616     99.17
3764673    4912087     1.30 983237267    8308238     0.84 47989639    479042     99.00
[...]
The wss tool shows a 12 Mbyte working set, and pmcarch shows a 99% LLC hit ratio. The LLC on this CPU is 24 Mbytes, so this makes sense.
Now --oltp-table-size=10000000:
# ./wss.pl -C `pgrep -nx mysqld` 1
Watching PID 423 page references grow, output every 1 seconds...
Est(s)     RSS(MB)    PSS(MB)    Ref(MB)
1.010       403.66     400.59      86.88
2.020       403.66     400.59      90.40
3.040       403.66     400.59      93.71
4.050       403.66     400.59      96.19
5.060       403.66     400.59      99.02
6.080       403.66     400.59     100.80
[...]

# ./pmcarch
K_CYCLES   K_INSTR      IPC BR_RETIRED   BR_MISPRED  BMR% LLCREF      LLCMISS     LLC%
3857663    4361549     1.13 875905306    8270478     0.94 57942970    4478859    92.27
3674356    4403851     1.20 869671764    8307450     0.96 57444045    4518955    92.13
3858828    4483705     1.16 893992312    8480271     0.95 57808518    4843476    91.62
3701744    4321834     1.17 861744002    8144426     0.95 56775802    4456817    92.15
4067889    4932042     1.21 994934844    12570830    1.26 63358558    5001302    92.11
3703030    4378543     1.18 874329407    8307769     0.95 58147001    4529388    92.21
[...]
Now the WSS is over 80 Mbytes, which should bust the LLC, however, its hit ratio only drops to 92%. This may be because the access pattern is non-uniform, and there is a hotter area of that working set that is hitting from the LLC more than the colder area.
6.1.5. Working Set Size Profiling
I added a profile mode to the wss tool to shed some light on the access pattern. It steps up the sample duration by powers of 2. Here is the same MySQL workload:
# ./wss.pl -P 16 `pgrep -n mysqld` 0.001
Watching PID 423 page references grow, profile beginning with 0.001 seconds, 16 steps...
Est(s)     RSS(MB)    PSS(MB)    Ref(MB)
0.008       403.66     400.76       8.79
0.018       403.66     400.76      13.98
0.027       403.66     400.76      17.69
0.038       403.66     400.76      21.70
0.058       403.66     400.76      27.83
0.088       403.66     400.76      35.51
0.128       403.66     400.76      43.43
0.209       403.66     400.76      55.08
0.349       403.66     400.76      69.95
0.620       403.66     400.76      84.18
1.150       403.66     400.76      86.18
2.190       403.66     400.76      89.43
4.250       403.66     400.76      94.41
8.360       403.66     400.76     101.38
16.570      403.66     400.76     107.49
32.980      403.66     400.76     113.05
Here is a synthetic workload, which touches 100 Mbytes with a uniform access distribution:
# ./wss.pl -P 16 `pgrep -n bench` 0.001
Watching PID 34274 page references grow, profile beginning with 0.001 seconds, 16 steps...
Est(s)     RSS(MB)    PSS(MB)    Ref(MB)
0.008       201.11     200.11      46.29
0.017       201.11     200.11     100.03
0.027       201.11     200.11     100.03
0.037       201.11     200.11     100.03
0.048       201.11     200.11     100.03
0.067       201.11     200.11     100.03
0.107       201.11     200.11     100.03
0.177       201.11     200.11     100.03
0.318       201.11     200.11     100.03
0.577       201.11     200.11     100.03
1.098       201.11     200.11     100.03
2.128       201.11     200.11     100.03
4.188       201.11     200.11     100.03
8.298       201.11     200.11     100.03
16.508      201.11     200.11     100.03
32.918      201.11     200.11     100.03
This provides information for different uses of WSS: short durations for studying WSS CPU caching, and long durations for studying main memory residency.
Since workloads can vary, note that this is just showing WSS growth for the time that the tool was run. You might want to collect this several times to determine what a normal WSS profile looks like.
6.1.6. WSS Profile Charts
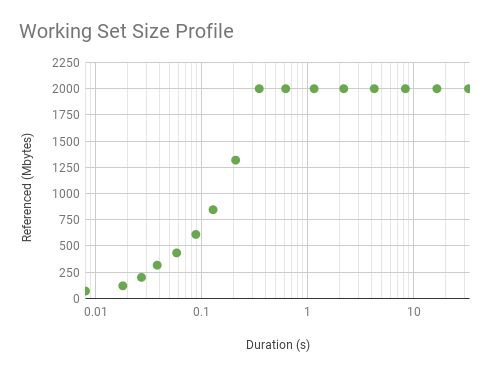
Graphing the earlier two profiles:
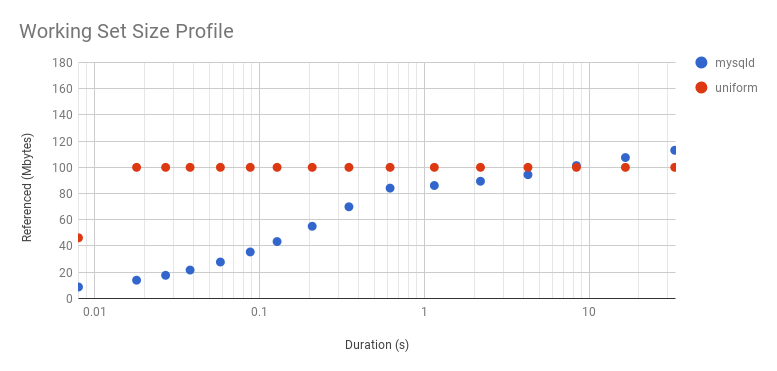
Note that I've used a log x-axis (here is a linear version). A sharp slope and then a flat profile is what we'd expect from a uniform distribution: the initial measurements haven't reached its WSS as the interval is so small, and there hasn't been enough CPU cycles to touch all the pages. As for mysqld: it takes longer to level out a little, which it does at 80 Mbytes after 16 ms, and then picks up again at 256 ms and climbs more. It looks like 80 Mbytes is hotter than the rest. Since workloads can vary second-by-second, I wouldn't trust a single profile: I'd want to take several and plot them together, to look for the trend.
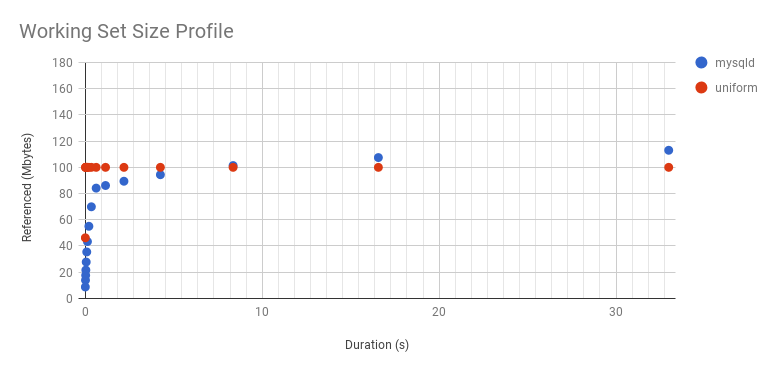
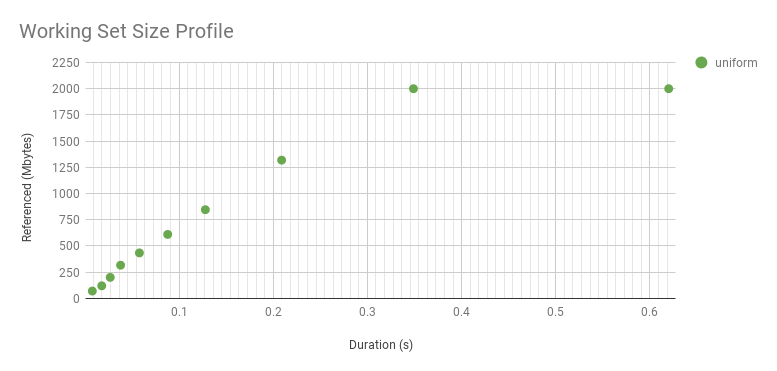
The "sharp slope" of the uniform distribution above only had one data point. Here is a 2 Gbyte WSS instead, also a uniform distribution, which takes longer for the program to reference, giving us more points to plot:
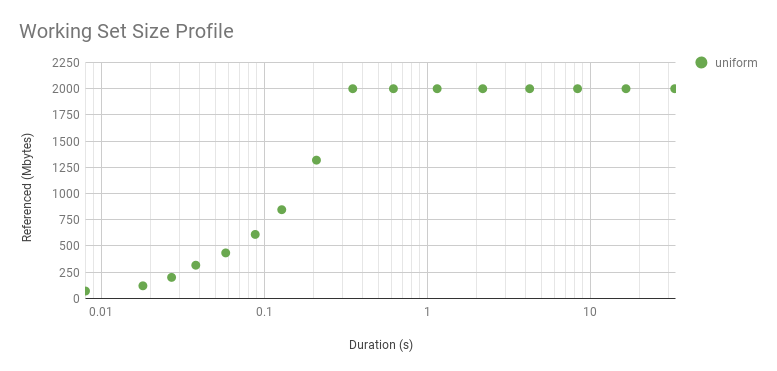
It curves upwards because it's a log axis. Here is linear (zoomed). While it looks interesting, this curve is just reflecting the WSS sample duration rather than the access distribution. The distribution really is uniform, as seen by the flat line after about 0.3 s. The knee point in this graph shows the minimum interval we can identify a uniform access distribution, for this WSS and program logic. The profile beyond this point reflects the access distribution. The profile beyond this point reflects the access distribution, and is interesting for understanding main memory usage. The profile before it is interesting for a different reason: understanding the workload that the CPU caches process over short intervals.
6.1.7. Estimated Duration and Accuracy
Here's how you might imagine this tool works:
- Reset referenced page flags for a process (instantaneous)
- Sleep for the duration
- Read referenced page flags (instantaneous)
Here's what really happens:
- Reset the first page flag for a process
- [... Reset the next page flag, then the next, then the next, etc. ...]
- Page flag reset completes
- Sleep for a duration
- Read the first page flags for the process
- [... Read the next page flag, then the next, then the next, etc. ...]
- Read complete
The working set is only supposed to be measured during step 4, the intended duration. But the application can touch memory pages after the flag was set during step 2, and before the duration has begun in step 4. The same happens for the reads in step 6: an application may touch memory pages during this stage before the flag was checked. So steps 2 and 6 effectively inflate the sleep duration. These stages for large processes (>100 Gbytes) can take over 500 ms of CPU time, and so a 10 ms target duration can really be reflecting 100s of ms of memory changes.
To inform the end user of this duration inflation, this tool provides an estimated duration, measuring from the midpoint of stage 2 to the midpoint of stage 6. For small processes, this estimated duration will likely equal the intended duration. But for large processes, it will show the inflated time.
6.1.8. Precise Working Set Size Durations
I've experimented with one way to get precise durations: sending the target process SIGSTOP and SIGCONT signals, so that it is paused while page maps are set and read, and only runs for the intended duration of the measurement. This is dangerous
6.2. Experimentation: Linux Idle Page Flag
This is a newer approach added in Linux 4.3 by Vladimir Davydov, which introduces Idle and Young page flags for more reliable working set size analysis, and without drawbacks like mucking with the referenced flag which could confuse the kernel reclaim logic. Jonathan Corbet has again written about this topic: Tracking actual memory utilization. Vladimir called it idle memory tracking, not to be confused with the idle page tracking patchset from many years earlier which introduced a kstaled for page scanning and summary statistics in /sys (which was not merged).
This is still a PTE accessed-bit approach: these extra idle and young flags are only in the kernel's extended page table entry (page_ext_flags), and are used to help the reclaim logic.
Idle memory tracking is a bit more involved to use. From the kernel documentation vm/idle_page_tracking.txt:
That said, in order to estimate the amount of pages that are not used by a
workload one should:

 1. Mark all the workload's pages as idle by setting corresponding bits in
    /sys/kernel/mm/page_idle/bitmap. The pages can be found by reading
    /proc/pid/pagemap if the workload is represented by a process, or by
    filtering out alien pages using /proc/kpagecgroup in case the workload is
    placed in a memory cgroup.

 2. Wait until the workload accesses its working set.

 3. Read /sys/kernel/mm/page_idle/bitmap and count the number of bits set. If
    one wants to ignore certain types of pages, e.g. mlocked pages since they
    are not reclaimable, he or she can filter them out using /proc/kpageflags.
I've written two proof-of-concept tools that use this, which are in the wss collection.
6.2.1. wss-v1: small process optimized
This version of this tool walks page structures one by one, and is suited for small processes only. On large processes (>100 Gbytes), this tool can take several minutes to write. See wss-v2.c, which uses page data snapshots and is much faster for large processes (50x), as well as wss.pl, which is even faster (although uses the referenced page flag).
Here is some example output, comparing this tool to the earlier wss.pl:
# ./wss-v1 33583 0.01
Watching PID 33583 page references during 0.01 seconds...
Est(s)     Ref(MB)
0.055        10.00

# ./wss.pl 33583 0.01
Watching PID 33583 page references during 0.01 seconds...
Est(s)     RSS(MB)    PSS(MB)    Ref(MB)
0.011        21.07      20.10      10.03
The output shows that that process referenced 10 Mbytes of data (this is correct: it's a synthetic workload).
Columns:
- Est(s): Estimated WSS measurement duration: this accounts for delays with setting and reading pagemap data.
- Ref(MB): Referenced (Mbytes) during the specified duration. This is the working set size metric.
6.2.2. wss-v1 WARNINGs
This tool sets and reads process page flags, which for large processes (> 100 Gbytes) can take several minutes (use wss-v2 for those instead). During that time, this tool consumes one CPU, and the application may experience slightly higher latency (e.g., 5%). Consider these overheads. Also, this is activating some new kernel code added in Linux 4.3 that you may have never executed before. As is the case for any such code, there is the risk of undiscovered kernel panics (I have no specific reason to worry, just being paranoid). Test in a lab environment for your kernel versions, and consider this experimental: use at your own risk.
6.2.3. wss-v2: large process optimized
This version of this tool takes a snapshot of the system's idle page flags, which speeds up analysis of large processes, but not small ones. See wss-v1.c, which may be faster for small processes, as well as wss.pl, which is even faster (although uses the referenced page flag).
Here is some example output, comparing this tool to wss-v1 (which runs much slower), and the earlier wss.pl:
# ./wss-v2 27357 0.01
Watching PID 27357 page references during 0.01 seconds...
Est(s)     Ref(MB)
0.806        15.00

# ./wss-v1 27357 0.01
Watching PID 27357 page references during 0.01 seconds...
Est(s)     Ref(MB)
44.571       16.00

# ./wss.pl 27357 0.01
Watching PID 27357 page references during 0.01 seconds...
Est(s)     RSS(MB)    PSS(MB)    Ref(MB)
0.080     20001.12   20000.14      15.03
The output shows that that process referenced 15 Mbytes of data (this is correct: it's a synthetic workload).
Columns:
- Est(s): Estimated WSS measurement duration: this accounts for delays with setting and reading pagemap data.
- Ref(MB): Referenced (Mbytes) during the specified duration. This is the working set size metric.
6.2.4. wss-v2 WARNINGs
This tool sets and reads system and process page flags, which can take over one second of CPU time, during which application may experience slightly higher latency (e.g., 5%). Consider these overheads. Also, this is activating some new kernel code added in Linux 4.3 that you may have never executed before. As is the case for any such code, there is the risk of undiscovered kernel panics (I have no specific reason to worry, just being paranoid). Test in a lab environment for your kernel versions, and consider this experimental: use at your own risk.
7. Experimentation: MMU Invalidation
This approach invalidates memory pages in the MMU, so that the MMU will soft fault on next access. This causes a load/store operation to hand control to the kernel to service the fault, at which point the kernel simply remaps the page and tracks that it was accessed. It can be done by the kernel, or the hypervisor for monitoring guest WSS.
7.2. Windows Reference Set
Microsoft have a great page on this: Reference sets and the system-wide effects on memory use. Some terminology differences:
-
Linux resident memory == Windows working set
Linux working set == Windows reference set
This method uses WPR or Xperf to collect a "reference set", which is a trace of accessed pages. I haven't done these myself yet, but it appears to use the MMU invalidation approach, followed by event tracing of page faults. The documentation notes the overheads:
WARNING: "Recording the trace of a reference set can have a significant effect on system performance, because all processes must fault large numbers of pages back into their working sets after their working sets are emptied."
I'll update this page with more details once I've used it. So far these are the only tools I've seen (other than the ones I wrote) to do WSS estimation.
Other
Other techniques for WSS estimation include:
- Application metrics: it depends on the application, but some may already track in-use memory as a WSS approximate.
- Application modifications: I've seen this studied, where application code is modified to track in-use memory objects. This can add significant overhead, and requires code changes.
- CPU simulation: tracking load/stores. Apps can run 10x or more slower in such simulators.
- Memory breakpoints: such as those that debuggers can configure. I'd expect massive overhead.
- Memory watchpoint: an approach could be built to use these; watchpoints were recently supported by bpftrace.
- MMU page invalidation: forcing pages to fault on access, revealing which are in use. This could be done by the kernel, or the hypervisor for monitoring guest WSS.
- Processor trace: and similar processor-level features that can log load/stores. Expected high overhead to process the log.
- Memory bus snooping: using custom hardware physically connected to the memory bus, and software to summarize observed accesses.
What I haven't seen is a ready-baked general purpose tool for doing WSS estimation. This is what motivated me to write my wss tools, based on Linux referenced and idle page flags, although each tool has its own caveats (although not as bad as other approaches).
Links & References
- clear_refs patch by David Rientjes, and his WSS estimation description (2007).
- How much memory am I really using? by Jonathan Corbet (2007).
- Documentation/vm/idle_page_tracking.txt by Vladimir Davydov (2015).
- Tracking actual memory utilization on lwn.net, by Jonathan Corbet (2015).
- Reference sets and the system-wide effects on memory use by Microsoft (2017).
- Low Cost Working Set Size Tracking, by Zhao, W., et al., USENIX ATC11, an example of hypervisor MMU invalidation.
- Dynamic Tracking of Page Miss Ratio Curve for Memory Management, by Zhou, P., et al., ASPLOS04, shows Miss Ratio Curve (MRC) and a hybrid MMU page invalidation with access bit scanning approach.
- Working Set Size (WSS) Tools for Linux on github.
- PMC Cloud Tools on github.
- perf PMCs here.