FreeBSD Memory Leak (and Growth) Flame Graphs
Under Construction
This page summarizes four dynamic and static tracing approaches I use for analyzing memory growths and leaks on an already running application, for both virtual and physical memory. These focus on the code path responsible for memory usage, examined as stack traces. I'll use Flame Graphs to visualize the traced code paths and the magnitude of memory usage.
See the main Memory Leak (and Growth) Flame Graphs page for the introduction and explanation of these techniques. That page uses Linux as an example target. On this page I'll use FreeBSD. It's assumed that you've read the main page, so many important topics won't be duplicated here.
1. Allocator Tracing
DTrace can be used to trace allocator functions, and either print events or perform in-kernel summaries. For example, libc malloc() stack trace counting in kernel context for a given PID (1819):
# dtrace -p 1819 -n 'pid$target:libc:malloc:entry { @[ustack()] = count(); }'
As an example of per-event tracing, Sanjeev Bagewadi wrote memleak.d using DTrace for Solaris in 2005, which dumps memory address details on every malloc(), realloc(), calloc(), and free(), which are then processed by a separate Perl program to detect leaks (example output here). This should be easily converted to work on FreeBSD, although printing each event has higher overhead than kernel summaries.
2. brk() syscall
In DTrace, tracing brk() can be done as a one-liner, which can also show the user-level stack that led to it. In this example, tracing "mysqld" processes only (MySQL server):
# dtrace -n 'syscall::brk:entry /execname == "mysqld"/ { @[ustack()] = count(); }'
^C
[...]

              libc.so.1`_brk_unlocked+0xa
              libc.so.1`sbrk+0x3b
              libmtmalloc.so.1`morecore+0x29
              libmtmalloc.so.1`malloc_internal+0xf3
              libmtmalloc.so.1`malloc+0x3b
              mysqld`my_malloc+0x32
              mysqld`init_alloc_root+0x73
              mysqld`_Z14init_sql_allocP11st_mem_rootjj+0x15
              mysqld`_ZN18Prepared_statementC1EP3THD+0xaf
              mysqld`_Z19mysqld_stmt_prepareP3THDPKcj+0x4a
              mysqld`_Z16dispatch_command19enum_server_commandP3THDPcj+0xefb
              mysqld`_Z24do_handle_one_connectionP3THD+0x13f
              mysqld`handle_one_connection+0x47
              mysqld`pfs_spawn_thread+0x16f
              libc.so.1`_thrp_setup+0x8a
              libc.so.1`_lwp_start
               32
Your kernel may or may not have brk() as a kernel-provided syscall, and therefore may not have a DTrace syscall::brk:entry probe. In that case, see the next section on mmap(). Another difference to watch out for is the sbrk() syscall, which, if a sbrk probe exists, needs to be traced as well. The above stack shows that sbrk() is provided by libc on this OS, which calls into brk().
If you're unlucky, the stack trace from brk() is broken. This could be due to omitting frame pointers, a compiler optimization. It can also be due to virtual machine languages, where the external profiler shows the stack frames for the VM but not the program it's running (that problem is supposed to be fixed in DTrace with ustack helpers).
Going further with brk(): the following DTrace script, brkbytes.d, records the stacks along with the size, in bytes, of the heap expansion. Like the one-liner, this matches any process named "mysqld":
#!/usr/sbin/dtrace -s

inline string target = "mysqld";
uint brk[int];

syscall::brk:entry /execname == target/ { self->p = arg0; }
syscall::brk:return /arg0 == 0 && self->p && brk[pid]/ {
	@[ustack()] = sum(self->p - brk[pid]);
}
syscall::brk:return /arg0 == 0 && self->p/ { brk[pid] = self->p; }
syscall::brk:return /self->p/ { self->p = 0; }
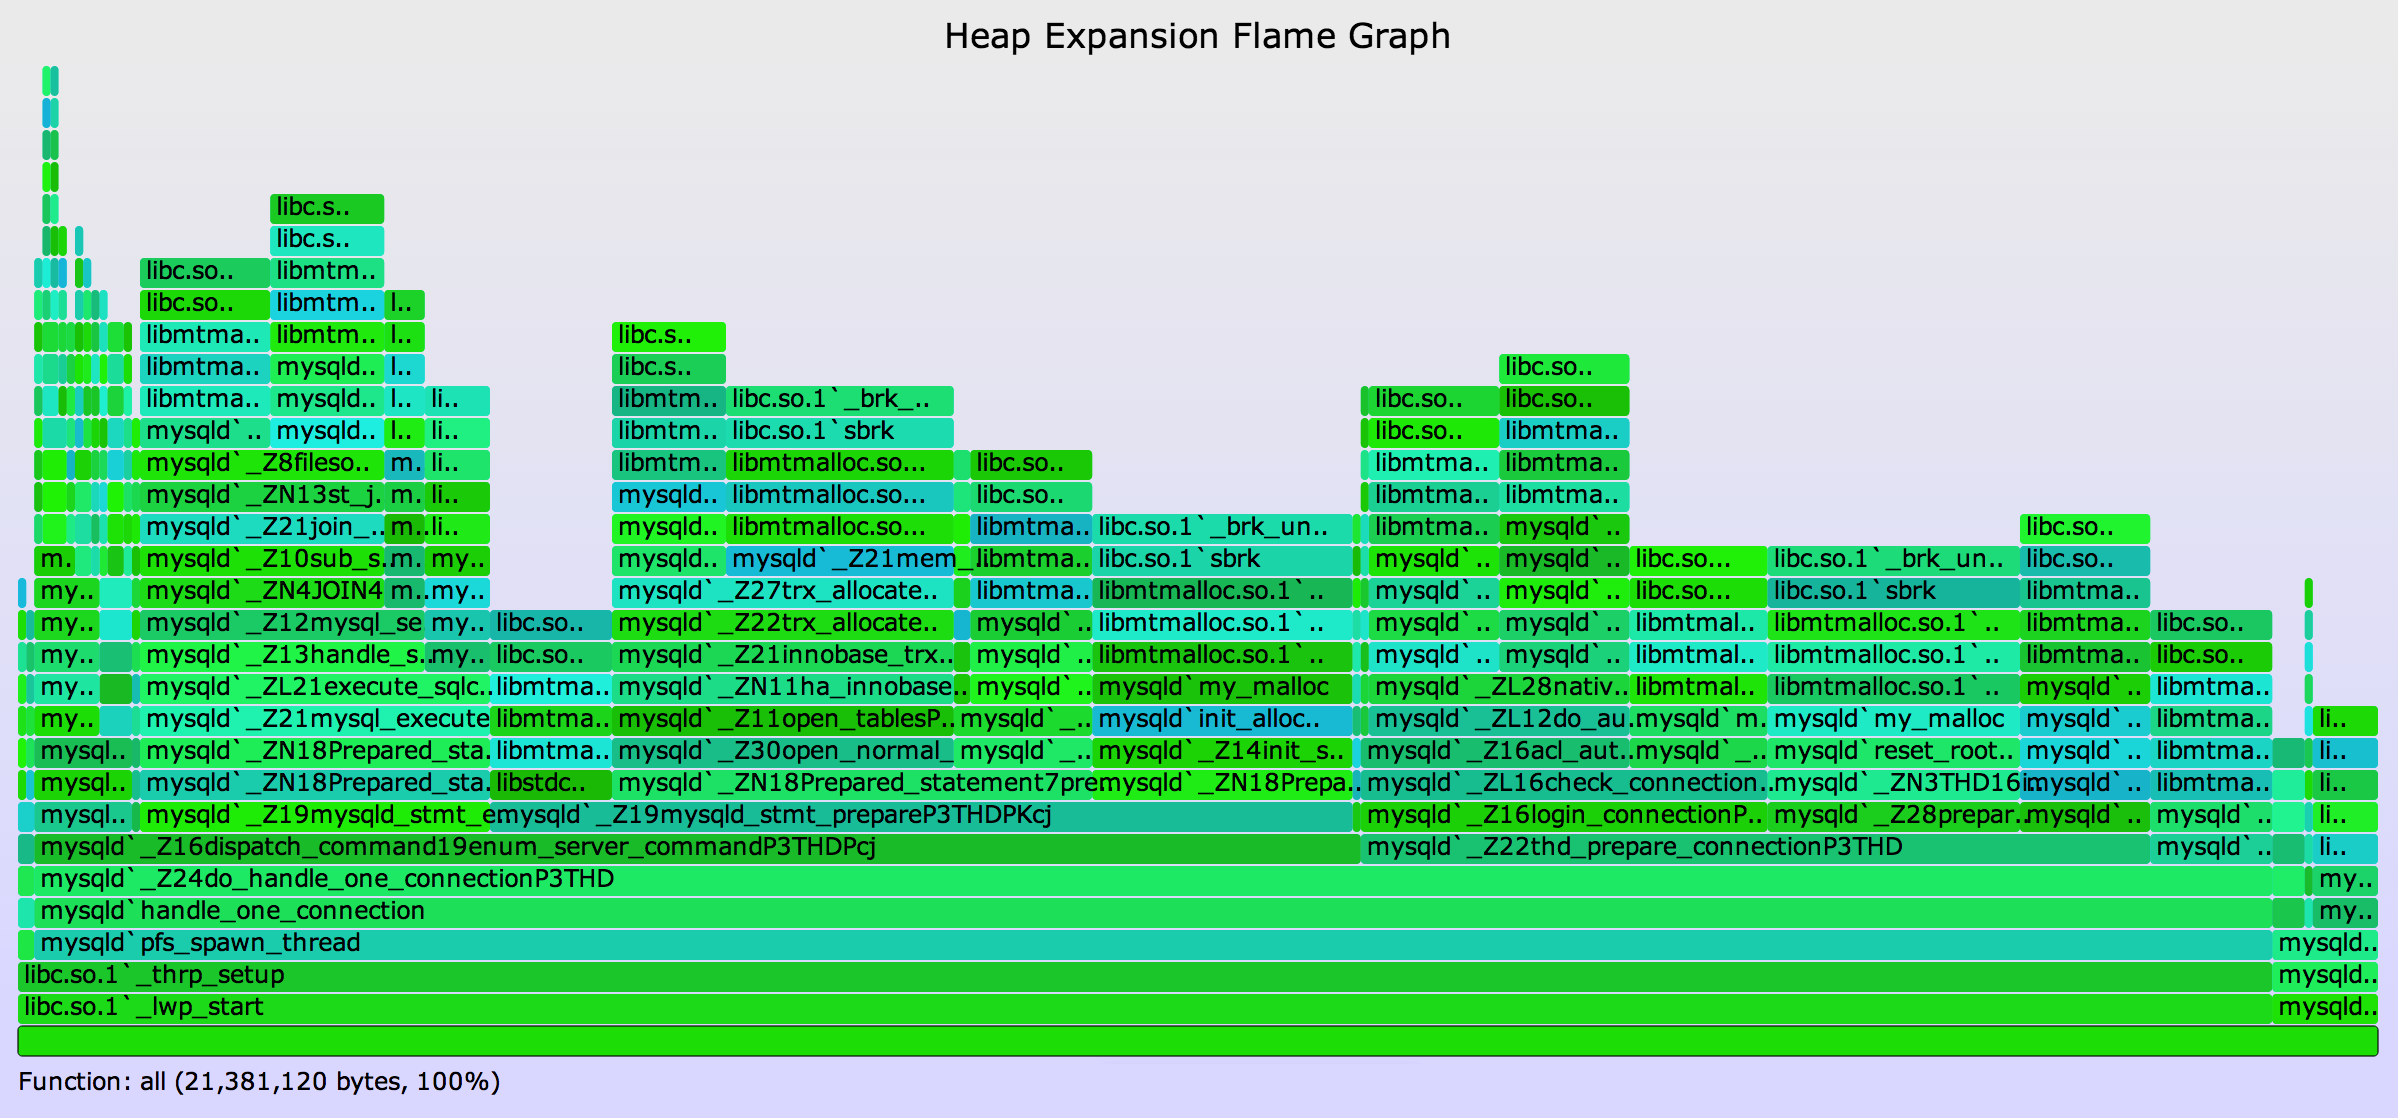
This was executed, and the output rendered as a heap expansion flame graph, using:
# ./brkbytes.d -n 'tick-60s { exit(0); }' > out.mysqld_brkbytes01
# ./stackcollapse.pl out.mysqld_brkbytes01 | ./flamegraph.pl --countname=bytes \
    --title="Heap Expansion Flame Graph" --colors=mem > mysqld_brkbytes.svg
Mouse over elements for details (if the SVG doesn't work in your browser, try the PNG):
This example MySQL server doesn't have a leak (that I know of), but rather shows memory growth from brk() calls. About 12 Mbytes were from processing a query, seen above dispatch_command() (mangled C++ signatures are shown here).
The total amount captured, 21 Mbytes, equals the virtual memory expansion as observed from other tools (prstat/top).
3. mmap() syscall
You can trace and display mmap() in a similar manner to brk(), and show the bytes of the new mappings. In DTrace this can be a one-liner, eg, for "mysqld" processes:
# dtrace -n 'syscall::mmap:entry /execname == "mysqld"/ { @[ustack()] = sum(arg1); }'
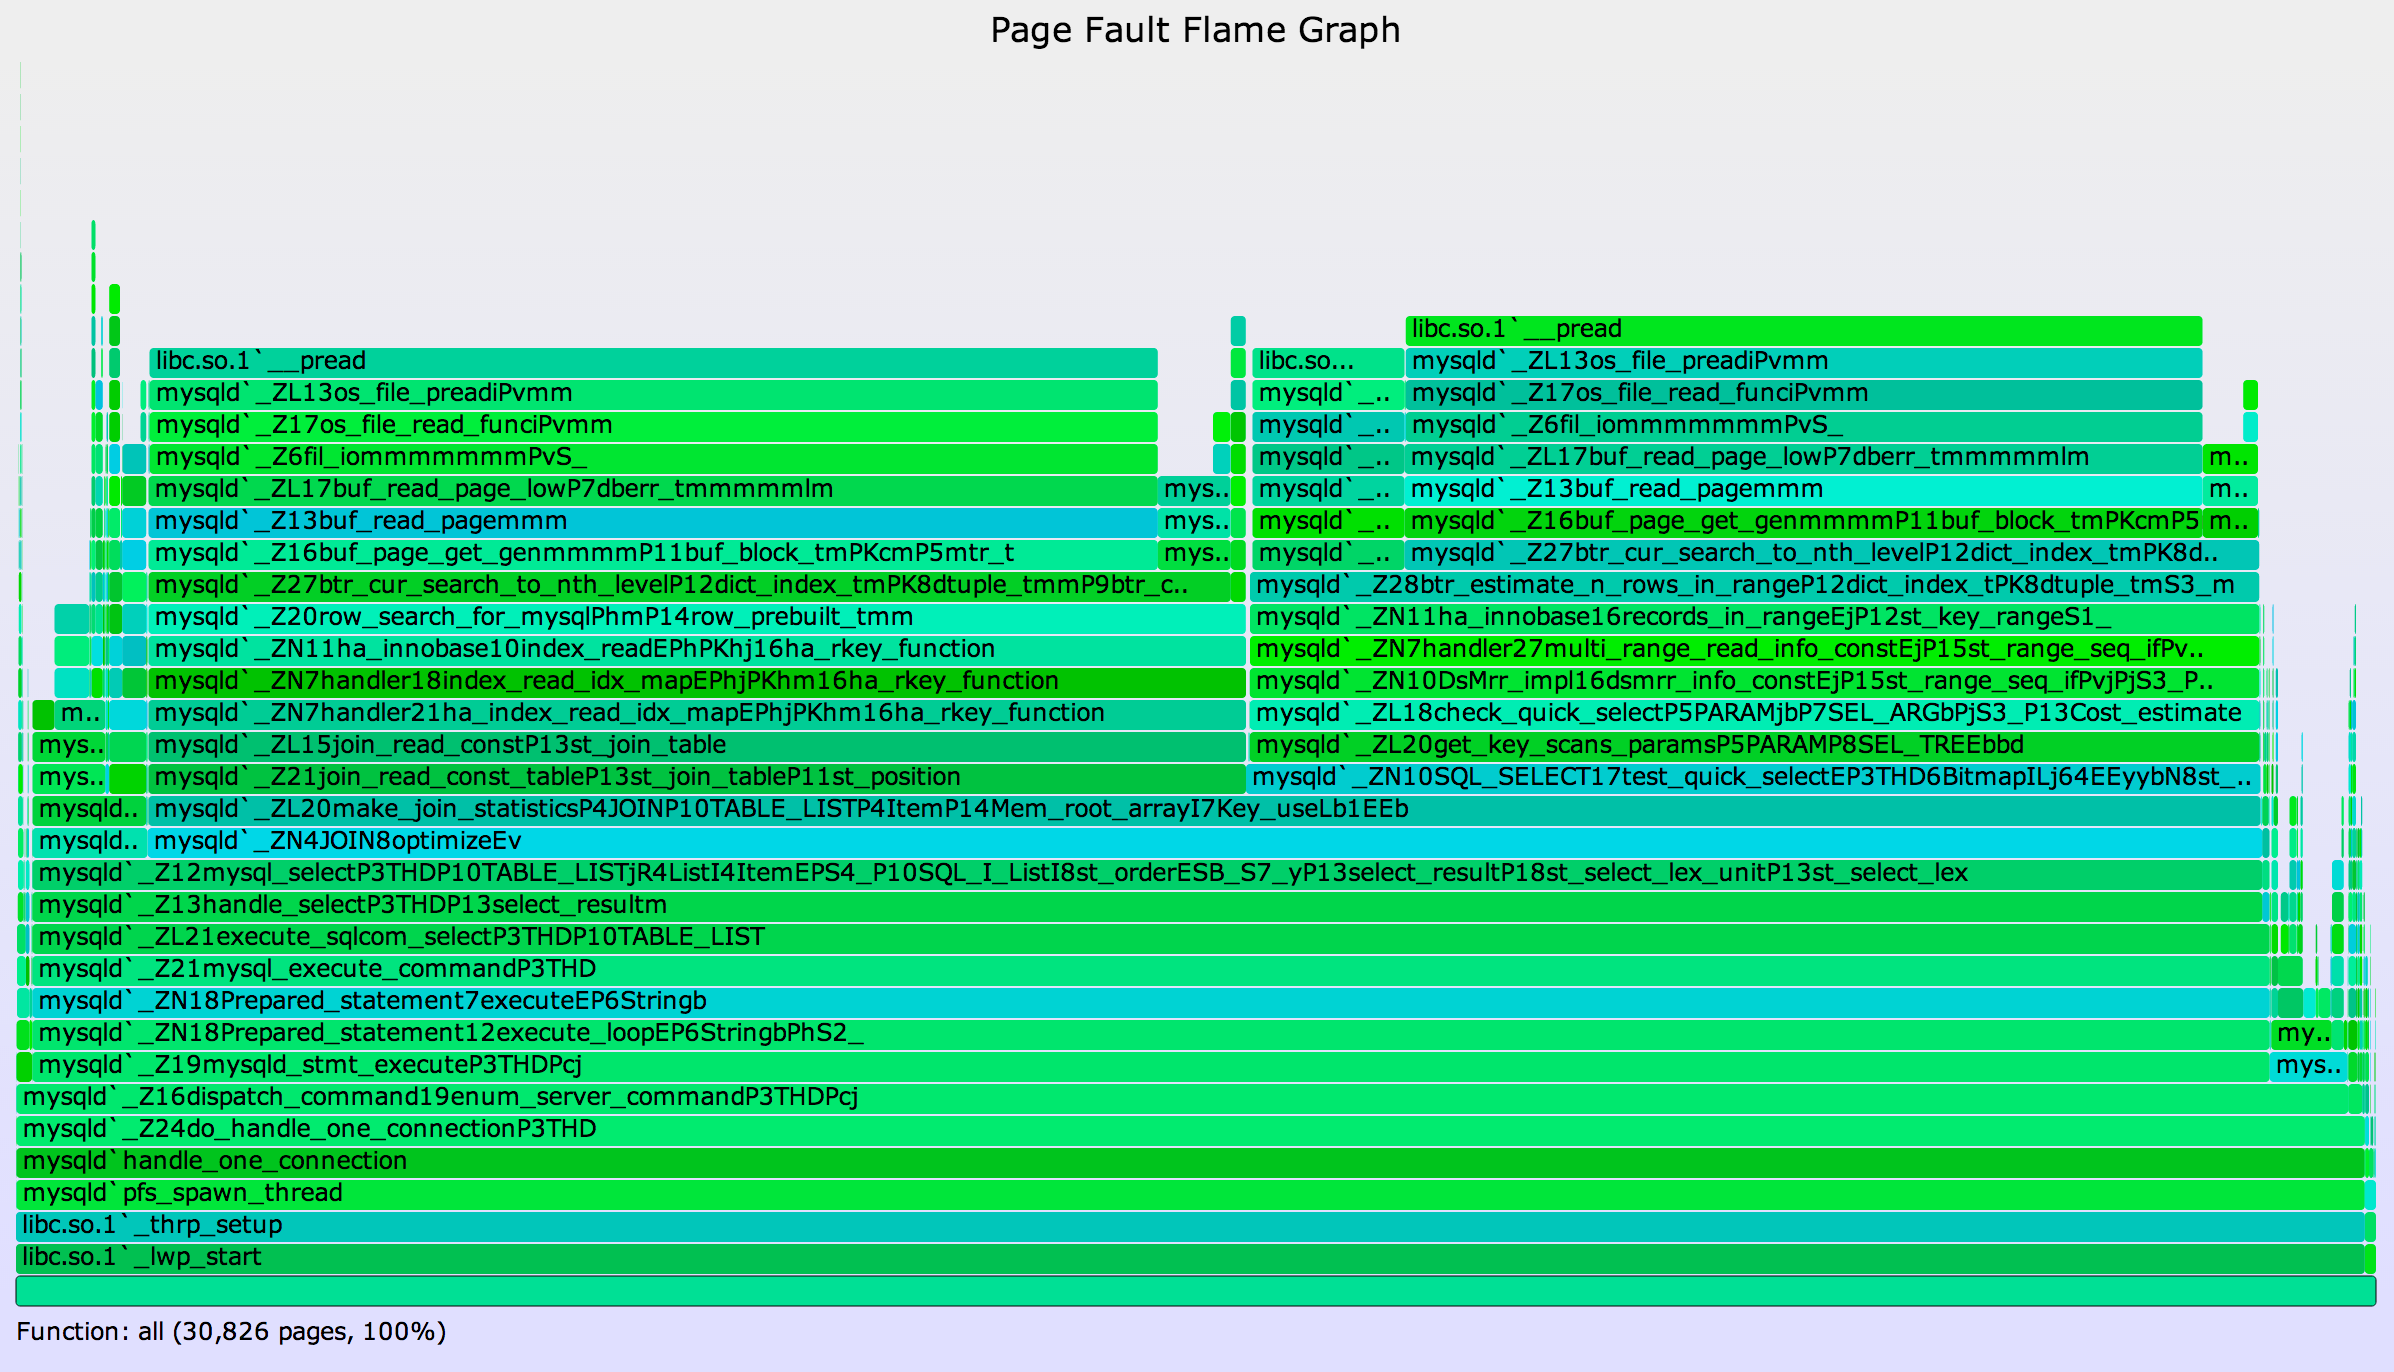
4. Page Faults
Page faults can traced in the following DTrace one-liner, which examines the same MySQL server:
# dtrace -x ustackframes=100 -n 'vminfo:::as_fault /execname == "mysqld"/ {
    @[ustack()] = count(); } tick-60s { exit(0); }' > out.mysqld_fault01
# ./stackcollapse.pl out.mysqld_fault01 | ../flamegraph.pl --countname=pages \
    --title="Page Fault Flame Graph" --colors=mem > mysqld_fault.svg
The total amount captured, about 120 Mbytes (30,826 x assumed 4 Kbyte page size), equals the resident memory expansion as observed from other tools (prstat/top).
Return to the main Memory Flame Graphs page.