

AI Flame Graphs are now open source and include Intel Battlemage GPU support, which means it can also generate full-stack GPU flame graphs for providing new insights into gaming performance, especially when coupled with FlameScope (an older open source project of mine). Here's an example of GZDoom, and I'll start with flame scopes for both CPU and GPU utilization, with details annotated:
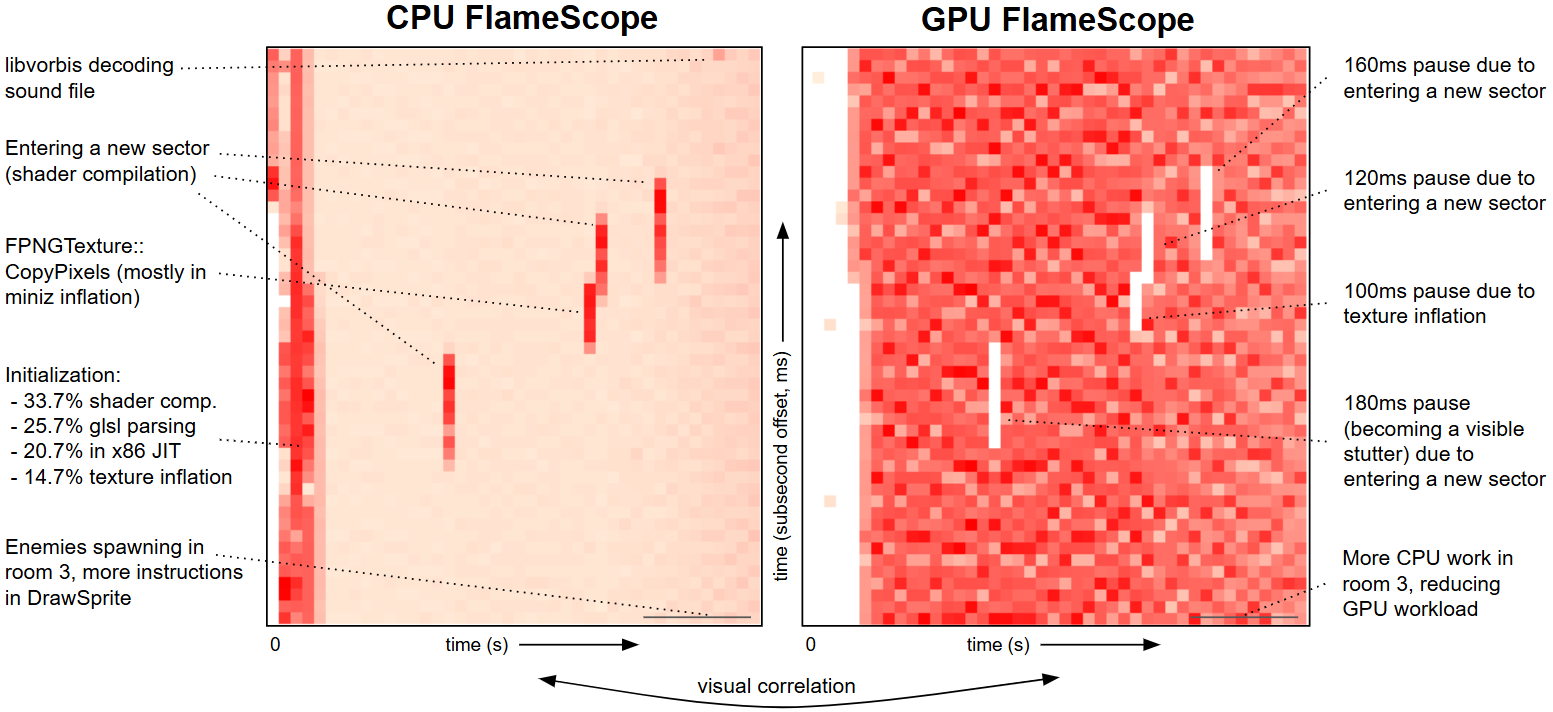
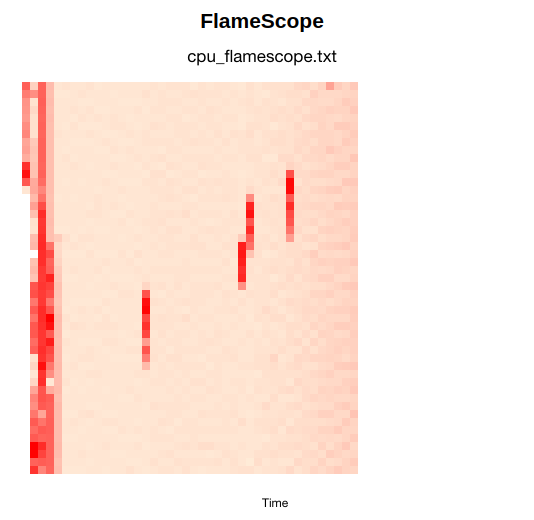
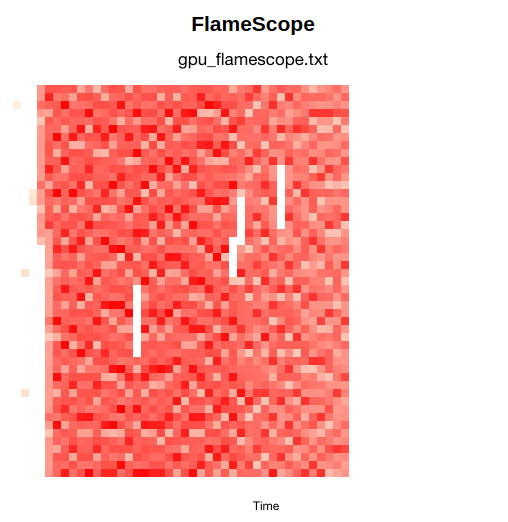
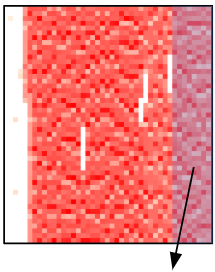
(Here are the raw CPU and GPU versions.) FlameScope shows a subsecond-offset heatmap of profile samples, where each column is one second (in this example, made up of 50 x 20ms blocks) and the color depth represents the number of samples, revealing variance and perturbation that you can select to generate a flame graph just for that time range. Update: the row size can be ajusted (it is limited by the sample rate captured in the profile), e.g., you could generate 60 rows to match 60fps games.
Putting these CPU and GPU flame scopes side by side has enabled your eyes to do pattern matching to solve what would otherwise be a time-consuming task of performance correlation. The gaps in the GPU flame scope on the right – where the GPU was not doing much work – match the heavier periods of CPU work on the left.
CPU Analysis
FlameScope lets us click on the interesting periods. By selecting one of the CPU shader compilation stripes we get the flame graph just for that range:
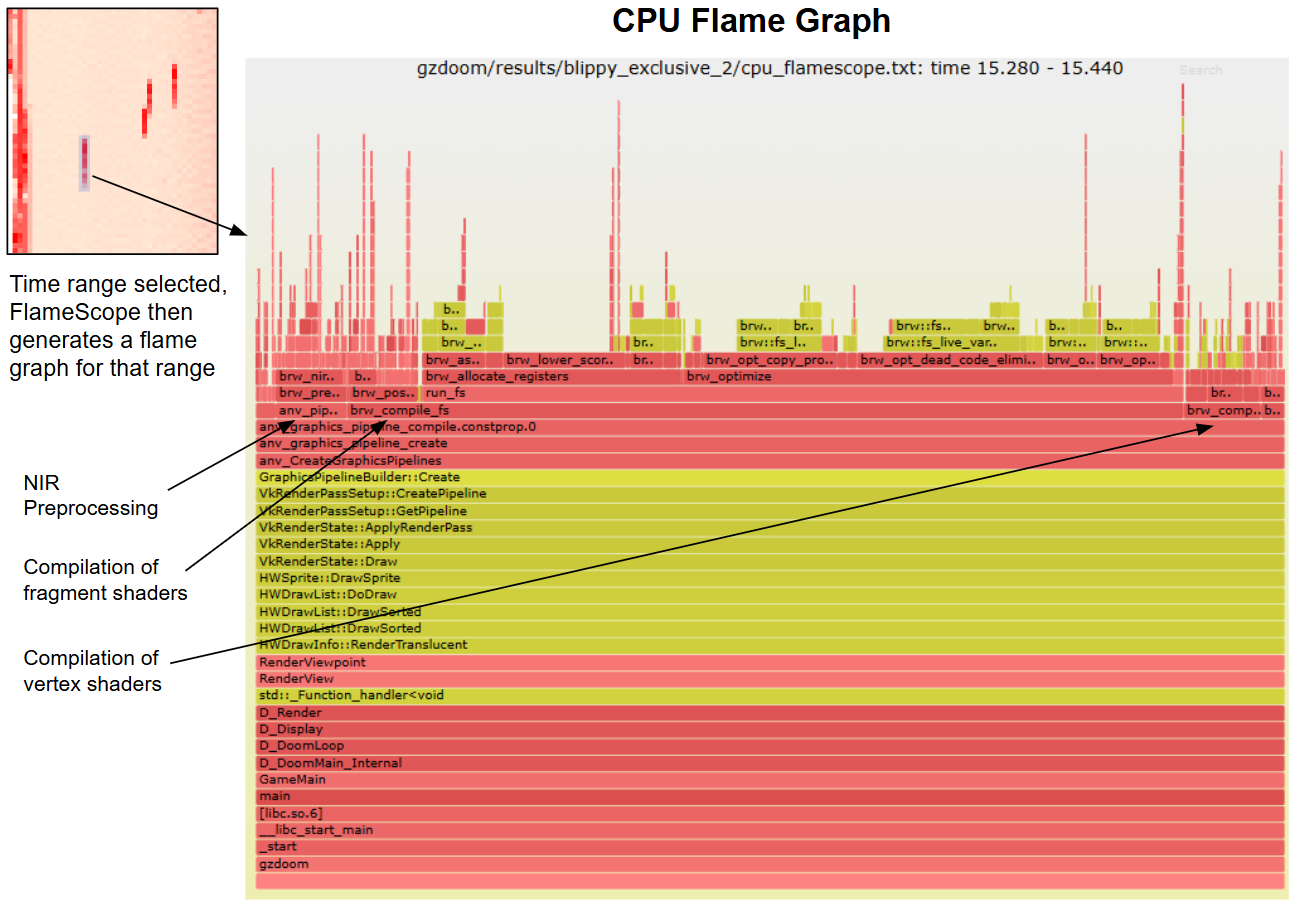
This is brilliant, and we can see exactly why the CPUs were busy for about 180 ms (the vertical length of the red stripe): it's doing compilation of GPU shaders and some NIR preprocessing (optimizations to the NIR intermediate representation that Mesa uses internally). If you are new to flame graphs, you look for the widest towers and optimize them first. Here is the interactive SVG.
CPU flame graphs and CPU flame scope aren't new (from 2011 and 2018, both open source). What is new is full-stack GPU flame graphs and GPU flame scope.
GPU Analysis
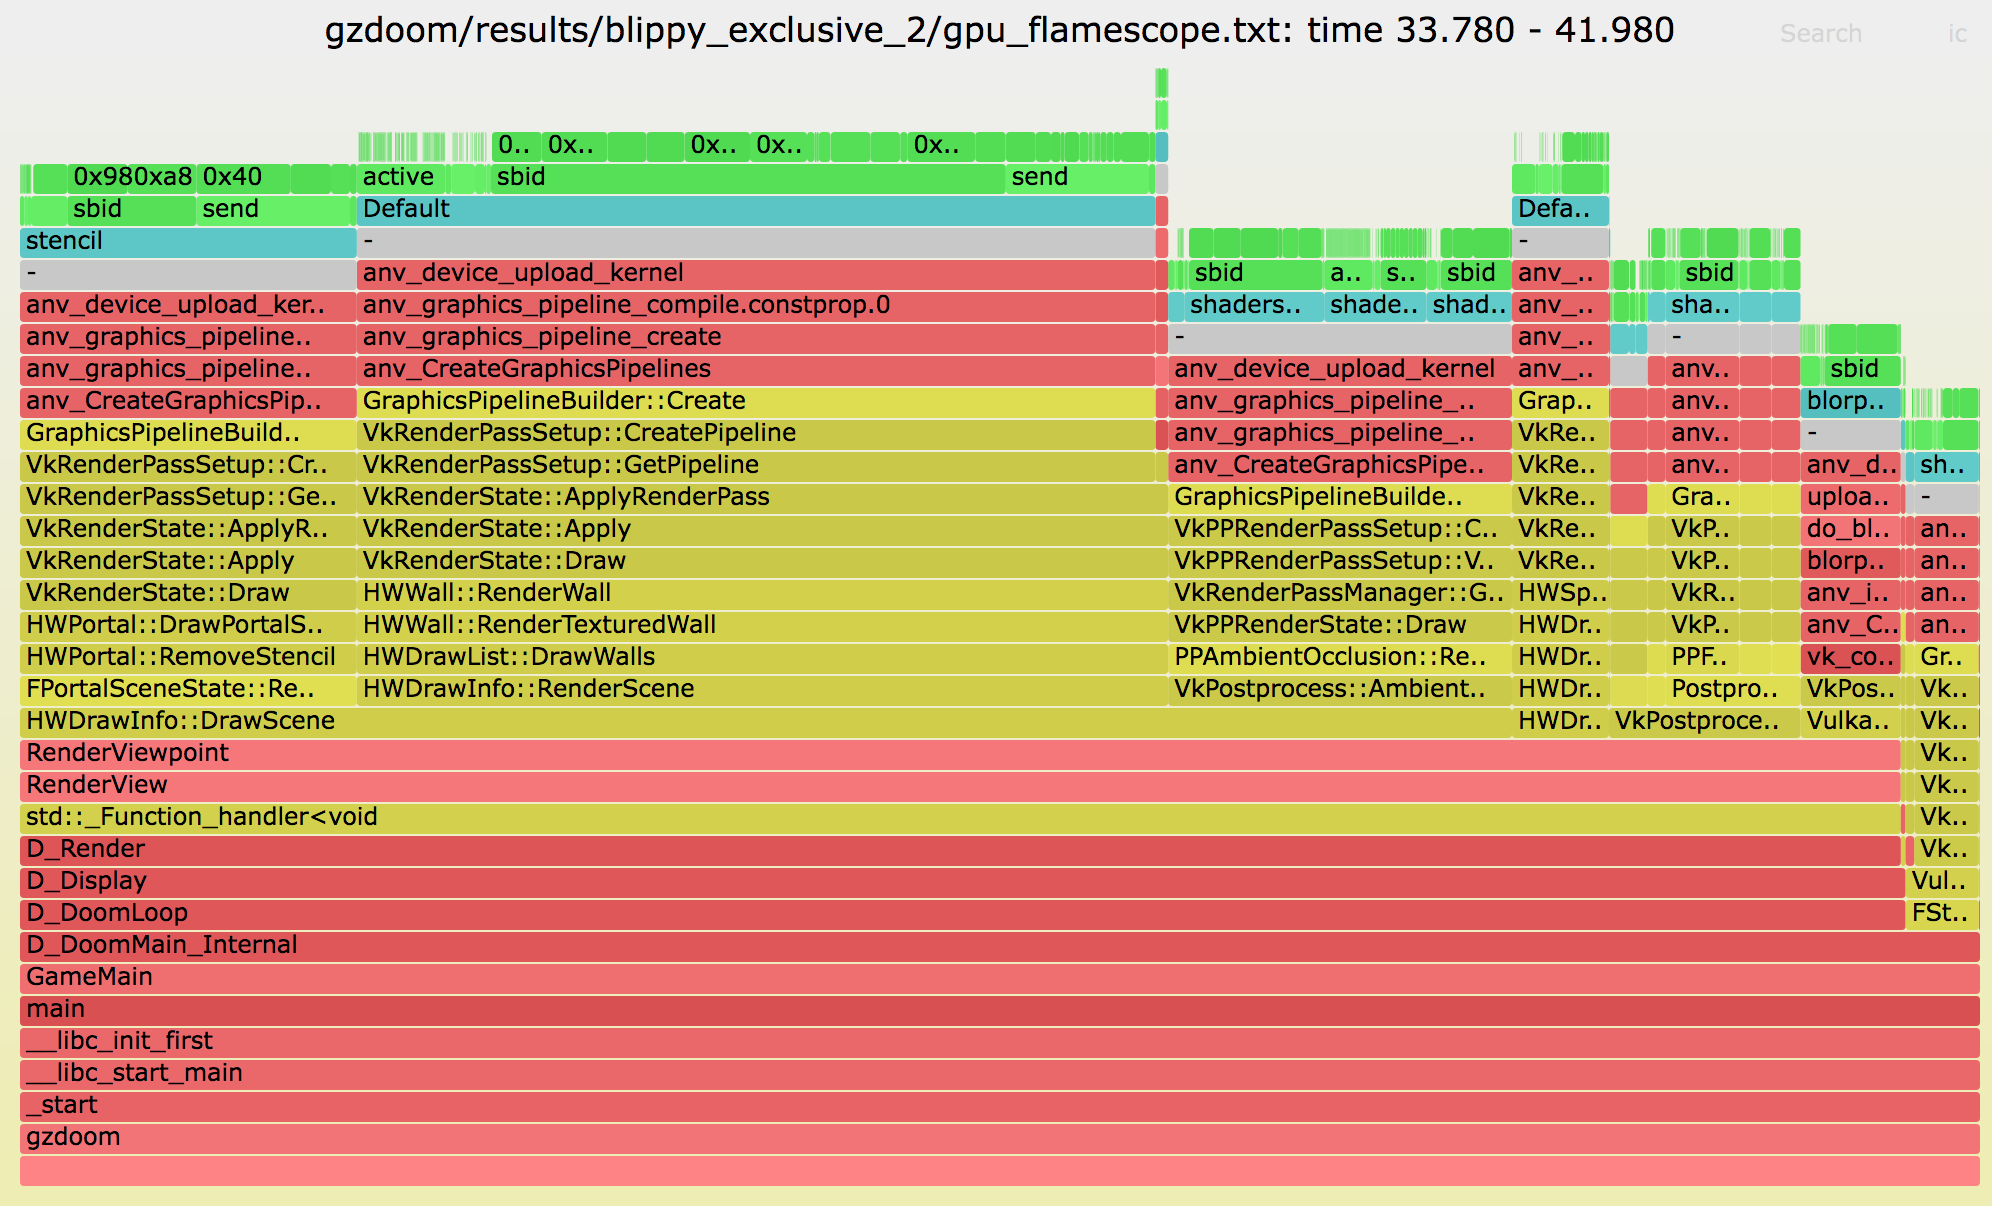
Interesting details can also be selected in the GPU FlameScope for generating GPU flame graphs. This example selects the "room 3" range, which is a room in the Doom map that contains hundreds of enemies. The green frames are the actual instructions running on the GPU, aqua shows the source for these functions, and red (C) and yellow (C++) show the CPU code paths that initiated the GPU programs. The gray "-" frames just help highlight the boundary between CPU and GPU code. (This is similar to what I described in the AI flame graphs post, which included extra frames for kernel code.) The x-axis is proportional to cost, so you look for the widest things and find ways to reduce them.

I've included the interactive SVG version of this flame graph so you can mouse-over elements and click to zoom. (PNG version.)
The GPU flame graph is split between stalls coming from rendering walls (41.4%), postprocessing effects (35.7%), stenciling (17.2%), and sprites (4.95%). The CPU stacks are further differentiated by the individual shaders that are causing stalls, along with the reasons for those stalls.
GZDoom
We picked GZDoom to try since it's an open source version of a well known game that runs on Linux (our profiler does not support Windows yet). Intel Battlemage makes light work of GZDoom, however, and since the GPU profile is stall-based we weren't getting many samples. We could have switched to a more modern and GPU-demanding game, but didn't have any great open source ideas, so I figured we'd just make GZDoom more demanding. We built GPU demanding maps for GZDoom (I can't believe I have found a work-related reason to be using Slade), and also set some Battlemage tunables to limit resources, magnifying the utilization of remaining resources.
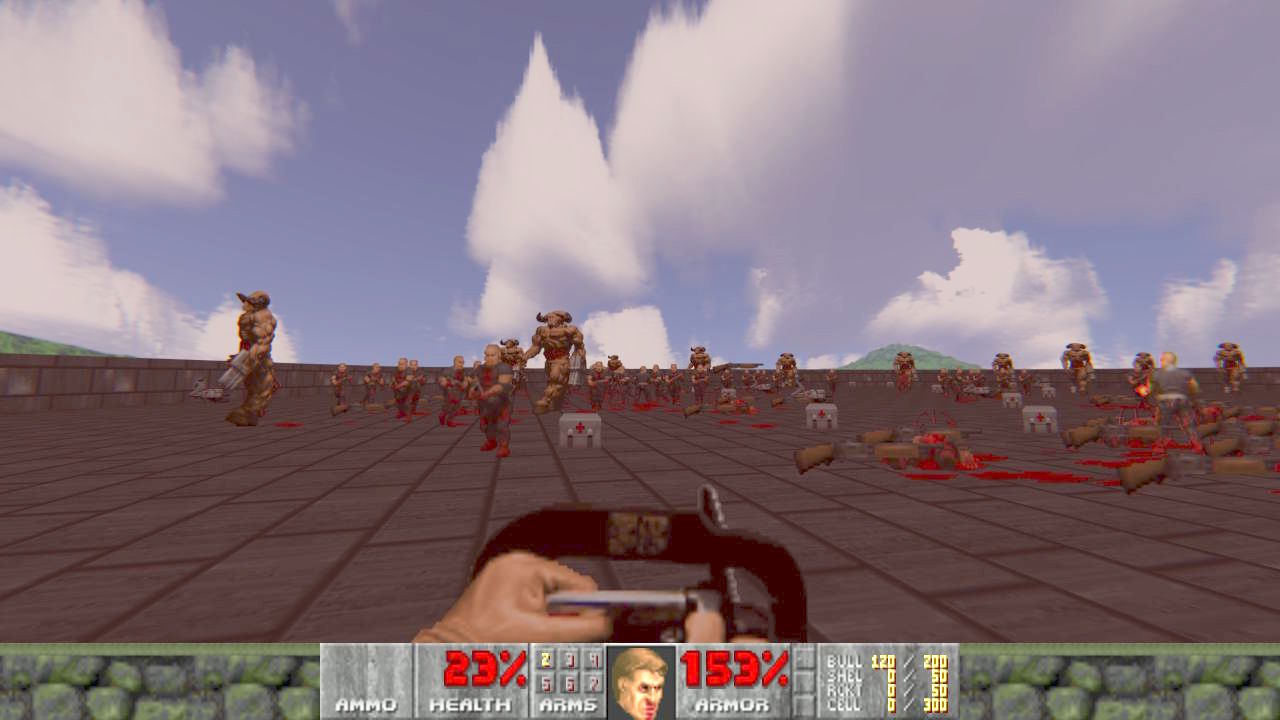
Our GZDoom test map has three rooms: room 1 is empty, room 2 is filled with torches, and room 3 is open with a large skybox and filled with enemies, including spawnpoints for Sergeants. This gave us a few different workloads to examine by walking between the rooms.
Using iaprof: Intel's open source accelerator profiler
The AI Flame Graph project is pioneering work, and has needed various changes to graphics compilers, libraries, and kernel drivers, not just the code but also how they are built. Since Intel has its own public cloud (the Intel® Tiber™ AI Cloud) we can fix the software stack in advance so that for customers it "just works." Check the available releases. It currently supports the Intel Max Series GPU.
If you aren't on the Intel cloud, or you wish to try this with Intel Battlemage, then it can require a lot of work to get the system ready to be profiled. Requirements include:
- A Linux system with superuser (root) access, so that eBPF and Intel eustalls can be used.
- A newer Linux kernel with the latest Intel GPU drivers. For Intel Battlemage this means Linux 6.15+ with the Xe driver; For the Intel Max Series GPU it's Linux 5.15 with the i915 driver.
- The Linux kernel built with Intel driver-specific eustall and eudebug interfaces (see the github docs for details). Some of these modifications are upstreamed in the latest versions of Linux and others are currently in progress. (These interfaces are made available by default on the Intel® Tiber™ AI Cloud.)

- All system libraries or programs that are being profiled need to include frame pointers so that the full stacks are visible, including Intel's oneAPI and graphics libraries. For this example, GZDoom itself needed to be compiled with frame pointers and also all libraries used by GZDoom (glibc, etc.). This is getting easier in the lastest versions of Fedora and Ubuntu (e.g., Ubuntu 24.04 LTS) which are shipping system libraries with frame pointers by default. But I'd expect there will be applications and dependencies that don't have frame pointers yet, and need recompilation. If your flame graph has areas that are very short, one or two frames deep, this is why.
If you are new to custom kernel builds and library tinkering, then getting this all working may feel like Nightmare! difficulty. Over time things will improve and gradually get easier: check the github docs. Intel can also develop a much easier version of this tool as part of a broader product offering and get it working on more than just Linux and Battlemage (either watch this space or, if you have an Intel rep, ask them to make it a priority).
Once you have it all working, you can run the iaprof command to profile the GPU. E.g.:
git clone --recursive https://github.com/intel/iaprof
cd iaprof
make deps
make
sudo iaprof record > profile.txt
cat profile.txt | iaprof flame > flame.svg
iaprof is modeled on the Linux perf command. (Maybe one day it'll become included in perf directly.) Thanks to Gabriel Muñoz for getting the work done to get this open sourced.
FAQ and Future Work
From the launch of AI flame graphs last year, I can guess what FAQ #1 will be: “What about NVIDIA?”. They do have flame graphs in Nsight Graphics for GPU workloads, although their flame graphs are currently shallow as it is GPU code only, and onerous to use as I believe it requires an interposer; on the plus side they have click-to-source. The new GPU profiling method we've been developing allows for easy, everything, anytime profiling, like you expect from CPU profilers.
Future work will include github releases, more hardware support, and overhead reduction. We're the first to use eustalls in this way, and we need to add more optimization to reach our target of <5% overhead, especially with the i915 driver.
Conclusion
We've open sourced AI flame graphs and tested it on new hardware, Intel Battlemage, and a non-AI workload: GZDoom (gaming). It's great to see a view of both CPU and GPU resources down to millisecond resolution, where we can see visual patterns in the flame scope heat maps that can be selected to produce flame graphs to show the code. We applied these new tools to GZDoom and explained GPU pauses by selecting the corresponding CPU burst and reading the flame graph, as well as GPU code use for arbitrary time windows.
While we have open sourced this, getting it all running requires Intel hardware and Linux kernel and library tinkering – which can be a lot of work. (Actually playing Doom on Nightmare! difficulty may be easier.) This will get better over time. We look forward to seeing if anyone can fight their way through this work in the meantime and what new performance issues they can solve.
Authors: Brendan Gregg, Ben Olson, Brandon Kammerdiener, Gabriel Muñoz.
Click here for Disqus comments (ad supported).