

I originally posted this at http://blogs.sun.com/brendan/entry/dram_latency.
In my previous post, I showed NFS random read latency at different points in the operating system stack. I made a few references to hits from DRAM, which were visible as a dark solid line at the bottom of the latency heat maps. This is worth exploring in a little more detail, as this is both interesting and another demonstration of Analytics.
Here is delivered NFS latency and disk latency, for disk + DRAM alone:
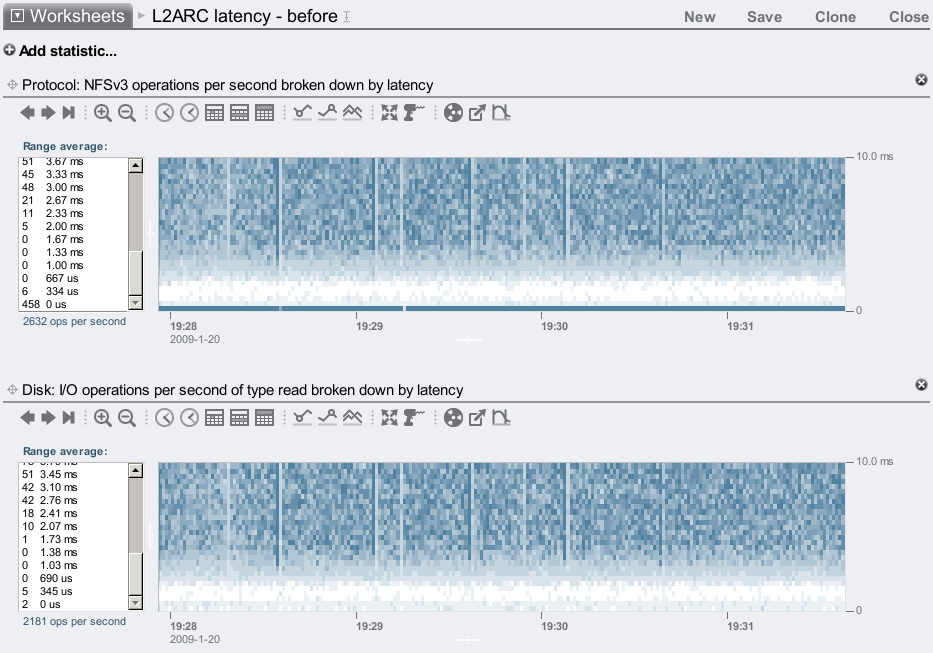
First clue is that the dark line at the bottom is in the NFS latency map only. This suggests the operation has returned to the client before it has reached the disk layer.
Zooming in the vertical time scale:
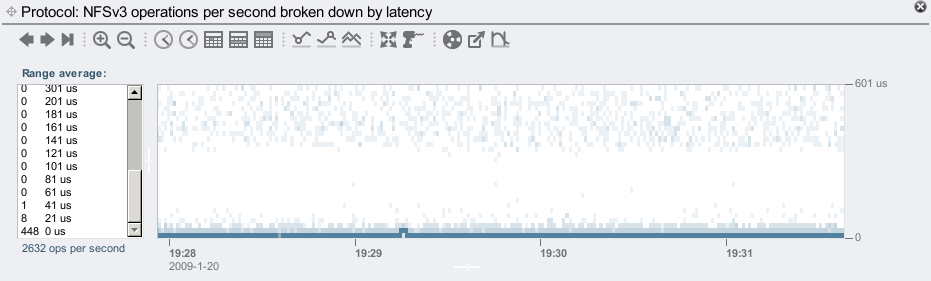
We can now see that these operations are mostly in the 0 us to 21 us range – which is very, very fast. DRAM fast. As an aside, there are other NFS operations apart from read can return from DRAM, including open, close, and stat. We know these are all reads from viewing the NFS operation type:
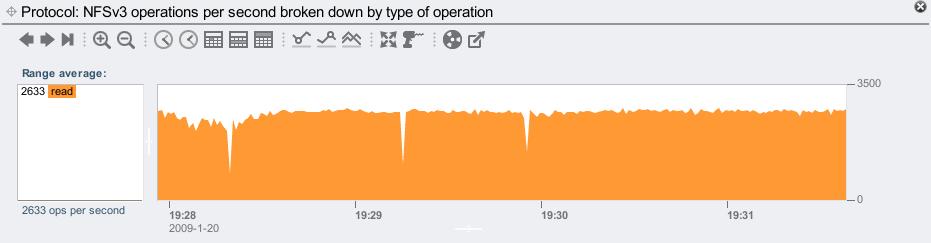
The average is 2633 NFS reads/sec, which includes hits from DRAM and reads from disk.
Now we'll use the "ZFS ARC" accesses statistic to see our DRAM cache hit rate (the ARC is our DRAM based filesystem cache):
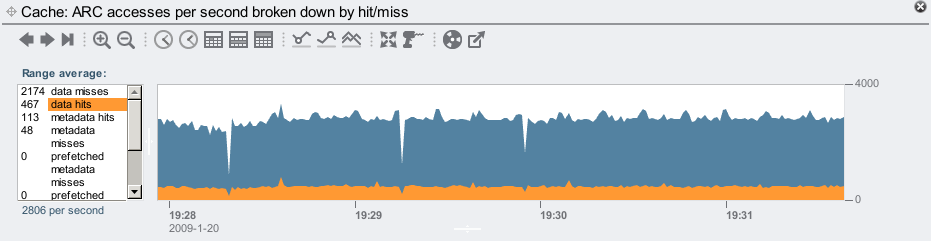
The averages for this visible range shows 467 data hits/sec, which is consistent with the number of fast NFS operations/sec that the latency map suggested were DRAM based.
This is amazing. We can examine the latency throughout the software stack, and clearly see the difference between DRAM and disk hits. You can probably see why we picked heat maps to show latency instead of line graphs showing average latency. Traditional performance tools provide average latency for these layers, but so much information has been lost when using averages. Since using these heat maps for latency, we've noticed many issues that may otherwise go unnoticed.