

I originally posted this at http://blogs.sun.com/brendan/entry/7410_hardware_update_and_analyzing.
Today we have released an update to the Sun Storage 7410, which upgraded the CPUs from Barcelona to Istanbul:
| 7410 (Barcelona) | 7410 (Istanbul) |
|---|---|
| Max 4 sockets quad core AMD Opteron CPU | Max 4 sockets of six core AMD Opteron CPU |
| Max 128 Gbytes DRAM | Max 256 Gbytes DRAM |
| HyperTransport 1.0 | HyperTransport 3.0 |
This is per head node, so a 2-way cluster can bring half a Terabyte of DRAM for filesystem caching. But what has me most excited is the upgrade of main system bus, from AMD's HyperTransport 1 to HyperTransport 3. In this blog post I'll explain why, and post numbers with the new 7410.
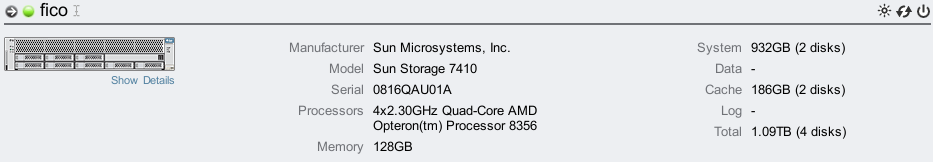
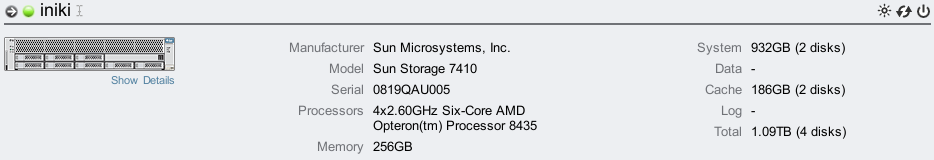
The following show the Maintenance->Hardware screen from the original and the new 7410:
New 7410 Results
The following results were collected from the two 7410s shown above, and by running the same workload on both systems (I increase the workload to get the most from the new 7410 system later in this post):
| Workload | 7410 (Barcelona) | 7410 (Istanbul) | Improvement |
|---|---|---|---|
| NFSv3 streaming cached read | 2.15 Gbytes/sec | 2.68 Gbytes/sec | 25% |
| NFSv3 8k read ops/sec | 127,143 | 223,969 | 75% |
A very impressive improvement from what were already great results.
Both of these results are reading a cached working set over NFS, so the disks are not involved. The CPUs and HyperTransport were upgraded, and these cached workloads were chosen to push those components to their limits (not the disks), to see the effect of the upgrade.
The following screenshots are the source of those results, and were taken from Analytics on the 7410, to show what the head node really did. These tests were performed by Sun's Open Storage Systems group (OSSG). I was able to login to Analytics on their systems and take screenshots from the tests they performed after the fact (since Analytics archives this data) and check that these results were consistent with my own – which they are.
Original 7410 (Barcelona)
Streaming cached read:
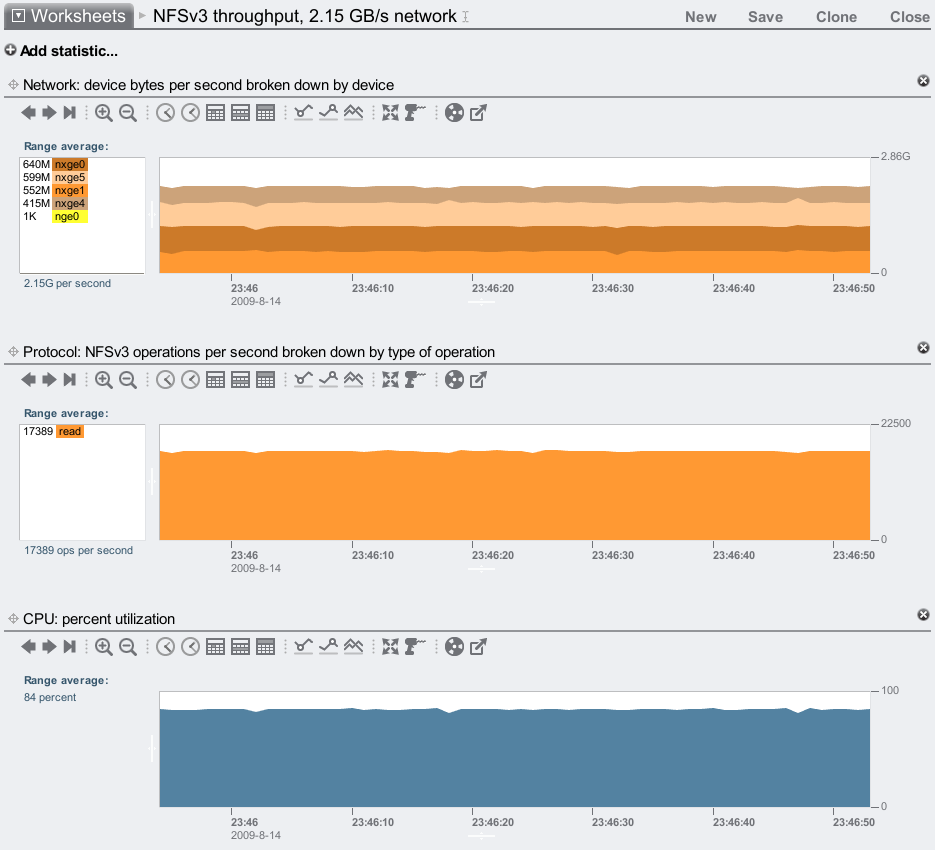
Notice that we can now reach 2.15 Gbytes/sec for NFSv3 on the original 7410 (60 second average of network throughput, which includes protocol headers). When I first blogged about the 7410 after launch, I was reaching 1.90 Gbytes/sec; sometime later that became 2.06 Gbytes/sec. The difference is the software updates, as we are gradually improving our performance release after release.
8k cached read ops:
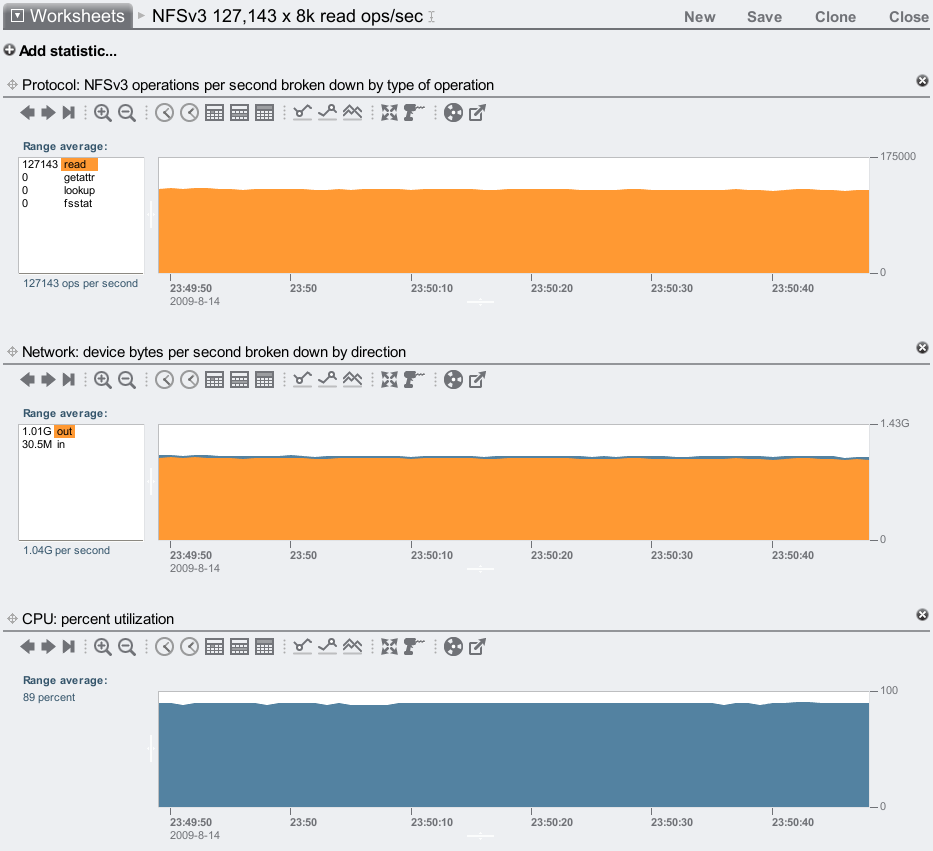
As a sanity check, we can multiply the observed NFS read ops/sec by their known size. For 8 Kbytes: 127,143 x 8 Kbytes = 0.97 Gbytes/sec. Our observed network throughput was 1.01 Gbytes/sec, which is consistent with 127K x 8 Kbyte read ops/sec (higher as it includes protocol headers).
New 7410 (Istanbul)
Streaming cached read:
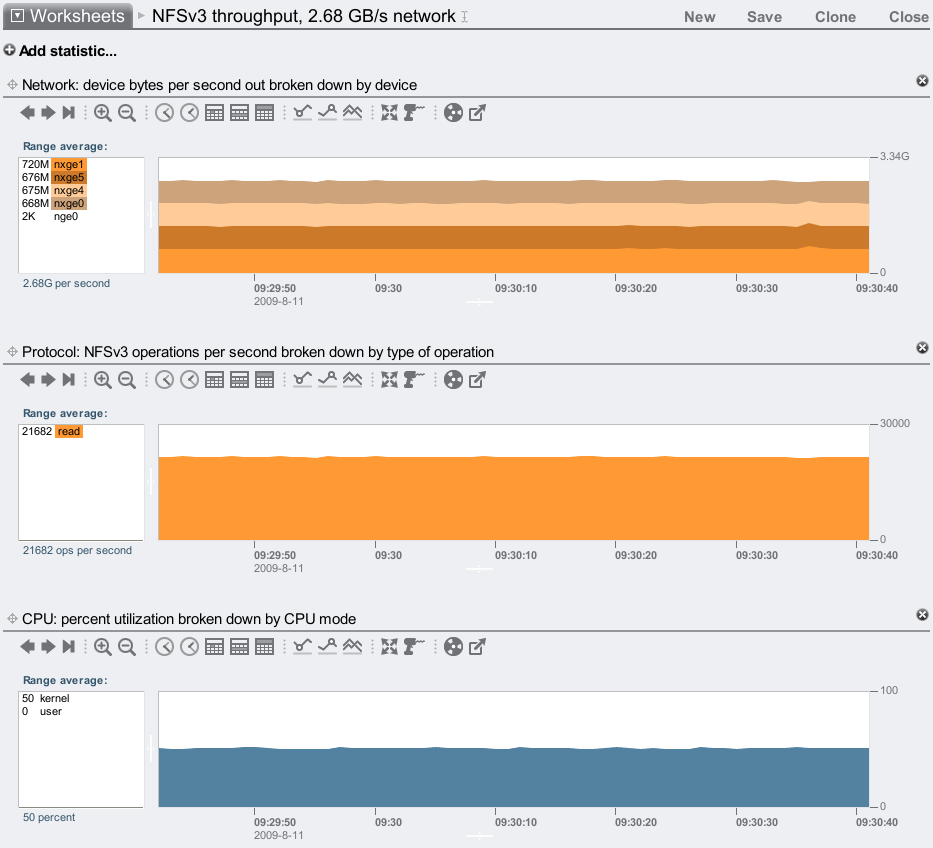
2.68 Gbytes/sec – awesome!
8k cached read ops:
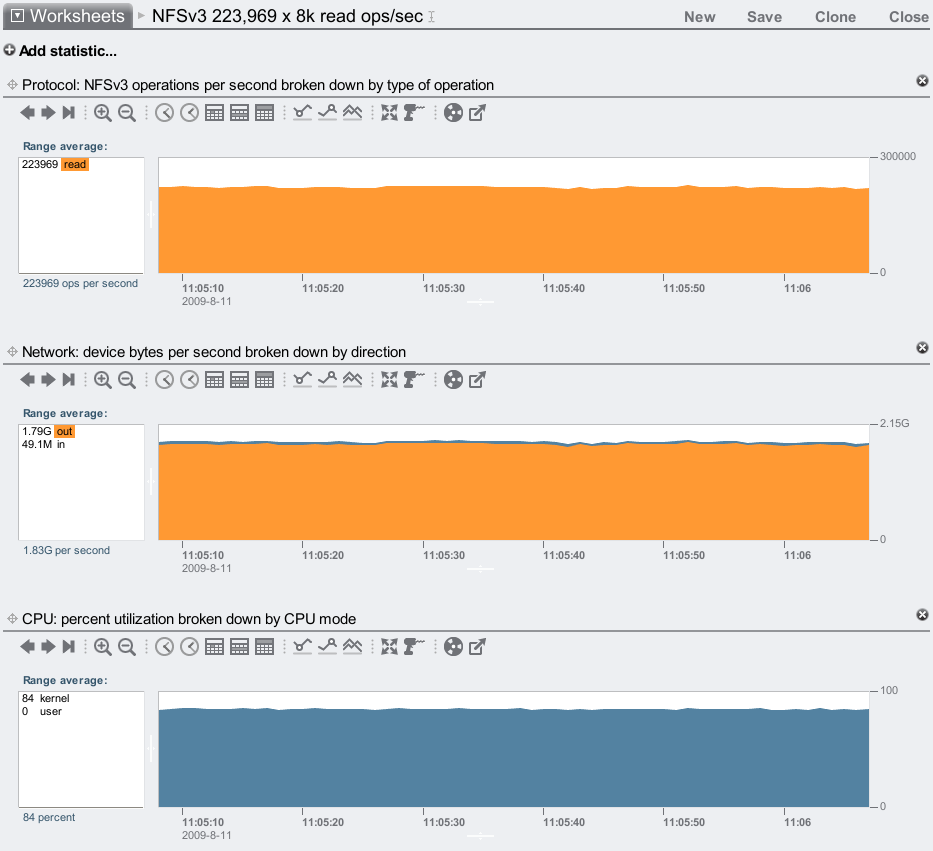
This is 75% faster than the original 7410 – no small hardware upgrade! As a sanity test, this showed 223,969 x 8 Kbytes = 1.71 Gbytes/sec. On the wire we observed 1.79 Gbytes/sec, which includes protocol headers. This is consistent with the expected throughput.
System
The systems tested above were the Barcelona-based and Istanbul-based 7410, both with max CPU and DRAM, and both running the latest software (2009.Q3.) The same 41 clients were used to test both 7410s.
The HyperTransport
The Sun Storage 7410 could support four ports of 10 GbE, with a theoretical combined maximum throughput of 40 Gbit/sec, or 4.64 Gbytes/sec. However in practice it was reaching about 2.06 Gbytes/sec when reading cached data over NFS. While over 2 Gbytes/sec is fantastic (and very competitive), why not over 3 or 4 Gbytes/sec?
First of all, if you keep adding high speed I/O cards to a system, you may run out of system resources to drive them before you run out of slots to plug them into. Just because the system lets you plug them all in, doesn't mean that the CPUs, busses and software can drive it at full speed. So, given that, what specifically stopped the 7410 from going faster?
It wasn't CPU horsepower: we had four sockets of quad-core Opteron and the very scalable Solaris kernel. The bottleneck was actually the HyperTransport.
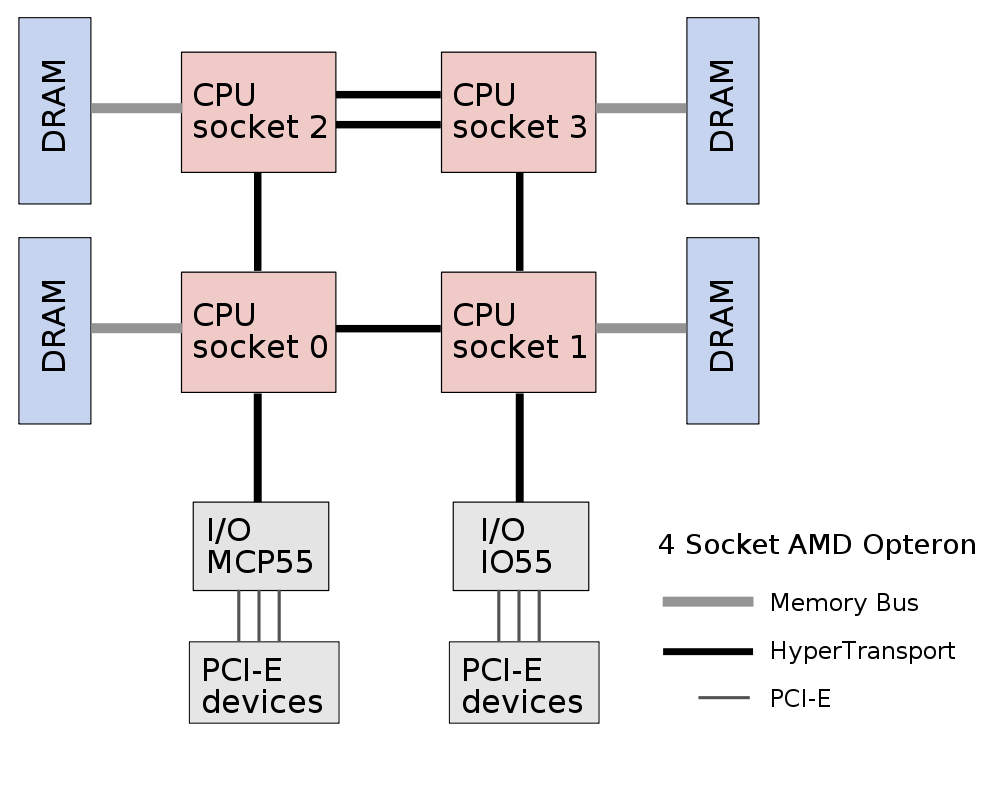
The HyperTransport is used as the CPU interconnect and the path to the I/O controllers. Any data transferred with the I/O cards (10 GbE cards, SAS HBAs, etc), will travel via the HTs. It's also used by the CPUs so they can access each other's memory. In the diagram above, picture CPU0 accessing the memory which is directly attached to CPU3, which would require two hops over HT links.
HyperTransport 1
A clue that the HyperTransport (and memory busses) could be the bottleneck was found with the Cycles Per Instruction (CPI):
walu# ./amd64cpi-kernel 5
          Cycles     Instructions      CPI     %CPU
    167456476045      14291543652    11.72    95.29
    166957373549      14283854452    11.69    95.02
    168408416935      14344355454    11.74    95.63
    168040533879      14320743811    11.73    95.55
    167681992738      14247371142    11.77    95.26
[...]
amd64cpi-kernel is a simple script I wrote (these scripts are not supported by Sun), to pull the CPI from the AMD CPU PICs (Performance Instrumentation Counters, aka Performance Monitoring Counters: PMCs). The higher the CPI, the more cycles are waiting for memory loads/stores, which are stalling instructions. A CPI of over 11 is the highest I've ever seen – a good indication that we are waiting a significant time for memory I/O.
Also note in the amd64cpi-kernel output that I included %CPU: CPU utilization. With a CPU utilization of over 95%, how many of you would be reaching for extra or faster CPU cores to improve the system? This is a problem for all %CPU measurements. Yes, the CPU was processing instructions, but it wasn't performing 'work' that you assume. Instead, those instructions are stalled waiting for memory I/O. Add faster CPUs, and you stall faster (doesn't help). Add more cores or sockets, and you could make the situation worse, spreading the workload over more CPUs can decrease the L1/L2 CPU cache hit rates, putting even more pressure on memory I/O.
To investigate the high CPI, I wrote more scripts to figure out what the memory buses and HT buses were doing. My amd64htcpu script shows the HyperTransport transmit Mbytes/sec, by both CPU and port (notice in the diagram each CPU has 3 HT ports):
 walu# ./amd64htcpu 1
     Socket  HT0 TX MB/s  HT1 TX MB/s  HT2 TX MB/s  HT3 TX MB/s
          0      3170.82       595.28      2504.15         0.00
          1      2738.99      2051.82       562.56         0.00
          2      2218.48         0.00      2588.43         0.00
          3      2193.74      1852.61         0.00         0.00
     Socket  HT0 TX MB/s  HT1 TX MB/s  HT2 TX MB/s  HT3 TX MB/s
          0      3165.69       607.65      2475.84         0.00
          1      2753.18      2007.22       570.70         0.00
          2      2216.62         0.00      2577.83         0.00
          3      2208.27      1878.54         0.00         0.00
     Socket  HT0 TX MB/s  HT1 TX MB/s  HT2 TX MB/s  HT3 TX MB/s
          0      3175.89       572.34      2424.18         0.00
          1      2756.40      1988.03       578.05         0.00
          2      2191.69         0.00      2538.86         0.00
          3      2186.87      1848.26         0.00         0.00
[...]
Each number shows:
     Socket  HT0 TX MB/s  HT1 TX MB/s  HT2 TX MB/s  HT3 TX MB/s
          0   CPU0-1        MCP55       CPU0-2             0.00
          1   CPU1-0       CPU1-3         IO55             0.00
          2   CPU2-3       CPU2-3       CPU2-0             0.00
          3   CPU3-2       CPU3-1       CPU3-2             0.00
This shows traffic on socket 0, HT0 was over 3 Gbytes/sec (and it was getting higher that that, approaching 4 Gbytes/sec – but I didn't keep the command output to include here). These HyperTransport 1 links have a theoretical maximum of 4 Gbytes/sec, which we are approaching. While they may not be at 100% utilization (for a 1 second interval), we have multiple cores per socket trying to access a resource that has reasonably high utilization, which will lead to stalling the instructions.
After identifying memory I/O on HyperTransport 1 as a potential bottleneck, we were able to improve the situation a few ways:
- zero-copy: reducing memory I/O that the kernel needs to do, in this case by not copying data if possible as it is passed through the kernel stack, instead managing references to it.
- card-reshuffle: we shuffled the I/O cards so that less traffic needed to go via the CPU0 to CPU1 HT interconnect. Originally we had all the network cards on one I/O controller, and all the SAS HBA cards on the other, so any disk I/O served to the network would travel via that hot HT link.
- thread-binding: certain threads (such as for nxge, the 10 GbE driver) were bound to specific CPUs, to increase the CPU L1/L2 cache hit rate, which would decrease the remote memory traffic, which would relieve HT pressure.
With these changes, our performance improved and the CPI was down to about 10. To go further, we needed HyperTransport 3.
HyperTransport 3
HT3 promised to triple the bandwidth, however when I first got a prototype HT3 system I was dissapointed to discover that the max NFSv3 throughput was the same. It turned out that I had accidentally been sent upgraded CPUs, but on a HT1 system! If anything, this further confirmed what I had suspected: faster CPUs didn't help throughput. We needed to upgrade the HT.
When I did get a HT3 system, the performance was considerably better: between 25% and 75%. HT links:
topknot# ./amd64htcpu 1
     Socket  HT0 TX MB/s  HT1 TX MB/s  HT2 TX MB/s  HT3 TX MB/s
          0      5387.91       950.88      4593.76         0.00
          1      6432.35      5705.65      1189.07         0.00
          2      5612.83      3796.13      6312.00         0.00
          3      4821.45      4703.95      3124.07         0.00
     Socket  HT0 TX MB/s  HT1 TX MB/s  HT2 TX MB/s  HT3 TX MB/s
          0      5408.83       973.48      4611.83         0.00
          1      6443.95      5670.06      1166.64         0.00
          2      5625.43      3804.35      6312.05         0.00
          3      4737.19      4602.82      3060.74         0.00
     Socket  HT0 TX MB/s  HT1 TX MB/s  HT2 TX MB/s  HT3 TX MB/s
          0      5318.46       971.83      4544.80         0.00
          1      6301.69      5558.50      1097.00         0.00
          2      5433.77      3697.98      6110.82         0.00
          3      4581.89      4464.40      2977.55         0.00
[...]
HT3 is sending more than 6 Gbytes/sec over some links. The CPI was down to 6 (and lower), from 10. The difference to performance numbers was huge:
-
Instead of 0.5 Gbytes/sec write to disk, we were now approaching 1.
Instead of 1 Gbyte/sec NFS read from disk, we were now approaching 2.
And instead of 2 Gbytes/sec NFS read from DRAM, we were now approaching 3.
Along with the CPU upgrade (which helps IOPS), and DRAM upgrade (helps caching working sets), the 7410 hardware update was looking to be an incredible upgrade to what was already a powerful system.
CPU PIC Analysis
If I've wet your appetite for more CPU PIC analysis, on Solaris run "cpustat -h" and fetch the document it refers to, which will contain a reference for the CPU PICs for the platform you are on. The scripts I used above are really not that complicated. They use shell and perl to wrap the output, which the man page for cpustat even suggests! Eg, the amd64cpi-kernel tool was:
#!/usr/bin/sh
#
# amd64cpi-kernel - measure kernel CPI and Utilization on AMD64 processors.
#
# USAGE: amd64cpi-kernel [interval]
#   eg,
#        amd64cpi-kernel 0.1            # for 0.1 second intervals
#
# CPI is cycles per instruction, a metric that increases due to activity
# such as main memory bus lookups.

interval=${1:-1}        # default interval, 1 second

set -- `kstat -p unix:0:system_misc:ncpus`              # assuming no psets,
cpus=$2                                                 # number of CPUs

pics='BU_cpu_clk_unhalted,sys0'                         # cycles
pics=$pics,'FR_retired_x86_instr_w_excp_intr,sys1'      # instructions

/usr/sbin/cpustat -tc $pics $interval | perl -e '
        printf "%16s %16s %8s %8s\\n", "Cycles", "Instructions", "CPI", "%CPU";
        while (<>) {
                next if ++$lines == 1;
                split;
                $total += $_[3];
                $cycles += $_[4];
                $instructions += $_[5];

                if ((($lines - 1) % '$cpus') == 0) {
                        printf "%16u %16u %8.2f %8.2f\\n", $cycles,
                            $instructions, $cycles / $instructions, $total ?
                            100 \* $cycles / $total : 0;
                        $total = 0;
                        $cycles = 0;
                        $instructions = 0;
                }
        }
'
A gotcha for this one is the "sys" modifier on the pics definitions; they make these PICs record activity during both user-code and kernel-code, not just user-code.
My 7410 Results
I've previously posted many numbers covering 7410 performance, although I had yet to collect the full set. I was missing iSCSI, FTP, HTTP and many others. This hardware upgrade changes everything, so all my previous numbers are now out of date. The numbers for the new 7410 are so far between 25% and 75% better than what I had posted previously!
Performance testing is like painting the Golden Gate Bridge: once you reach the end you must immediately begin at the start again. In our case, there are so many software and hardware upgrades that once you approach completing perf testing, the earlier numbers are out of date. The OSSG group (who gathered the numbers at the start of this post) are starting to help out so that we can test and share numbers more quickly.
I've created a new column of numbers on my summary post, and I'll fill out the new numbers as I get them.
Update 29-Sep-2009:
I've had a chance to gather max performance results for the Istanbul 7410 with the 2009.Q3 software. The results are excellent, and match what I saw in development (but I wanted to replicate these on the shipping software before I shared them).
The numbers I've shown so far (from the OSSG team) were from running the same workload on both the 7410s. That's interesting for observing deltas for a given workload, however I'm also interested in outright maximums possible (so that I can analyze the bottlenecks responsible). This may mean increasing a workload to better stress a more powerful server, which is what I've had to do here. My results follow, and a description of the setup used.
Max NFSv3 streaming cached read
Top speed test: this shows the fastest we can serve data over the NFSv3 protocol. A 200 Gbyte working set was used (200 x 1 Gbyte files), which caches entirely in the 7410's 256 Gbytes of DRAM, and the clients run multiple threads (usually 10) to repeatedly read over the files with a 1 Mbyte I/O size. Here's my first attempt:
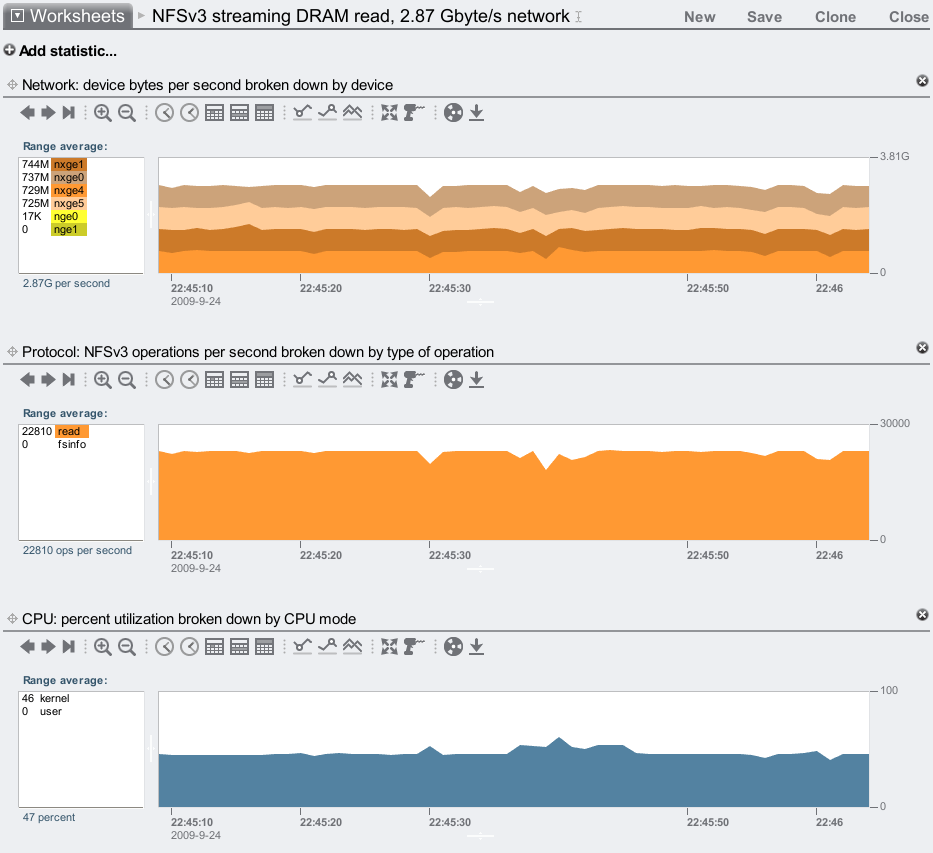
2.87 Gbytes/sec over the wire! I'd like to break 3.0, but I believe I've hit our next bottleneck: PCIe gen1. The network traffic is served by two dual-port 10 GbE cards. Each card can drive either of its 10 GbE ports to full speed (1.16 Gbytes/sec), but since it is a x8 PCIe gen1 card, it can't drive both ports at full speed at the same time. That would require 2.32 Gbytes/sec, and x8 PCIe gen1 has a theoretical max of 2.0 Gbytes/sec, but in practice actually moves between 1.4 to 1.5 Gbytes/sec (depending on PCIe payload size.) So, while that's the bottleneck for this particular test, this is still a truly great result – 2.87 Gbytes/sec on the wire.
Apart from the four 10 GbE ports in this 7410, there are also four 1 GbE ports on the system board. I only need 0.13 Gbytes/sec more to break 3.0...
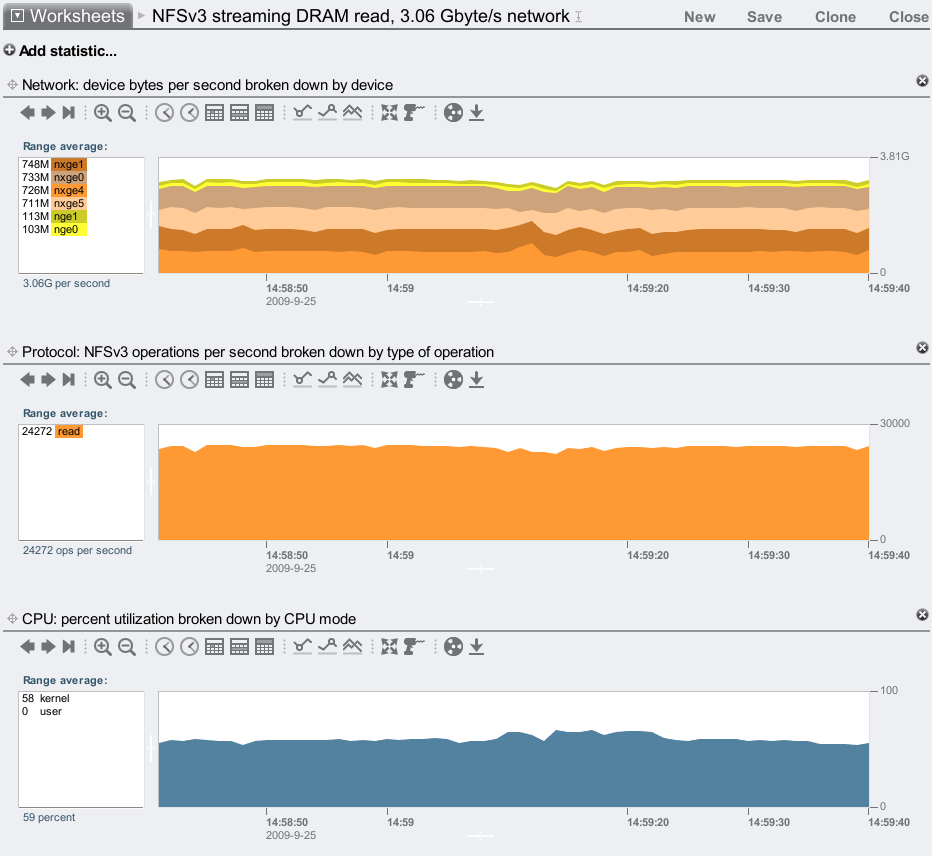
3.06 Gbytes/sec! This includes protocol headers as it's measured on the wire, but as I'm using jumbo frames it's mostly payload. Click the image to see the %CPU utilization – plenty of headroom available. I only hooked up two of the onboard 1 GbE ports, so I may be able to take this further if I plugged in the remaining two. For now, roughly 3.06 Gbytes/sec is a very competitive max throughput for NFSv3.
Max NFSv3 streaming disk read
Apart from reading from DRAM cache (which practical on this 7410 if your working set is less than 200 Gbytes), I'll also test max streaming read from disk – uncached:
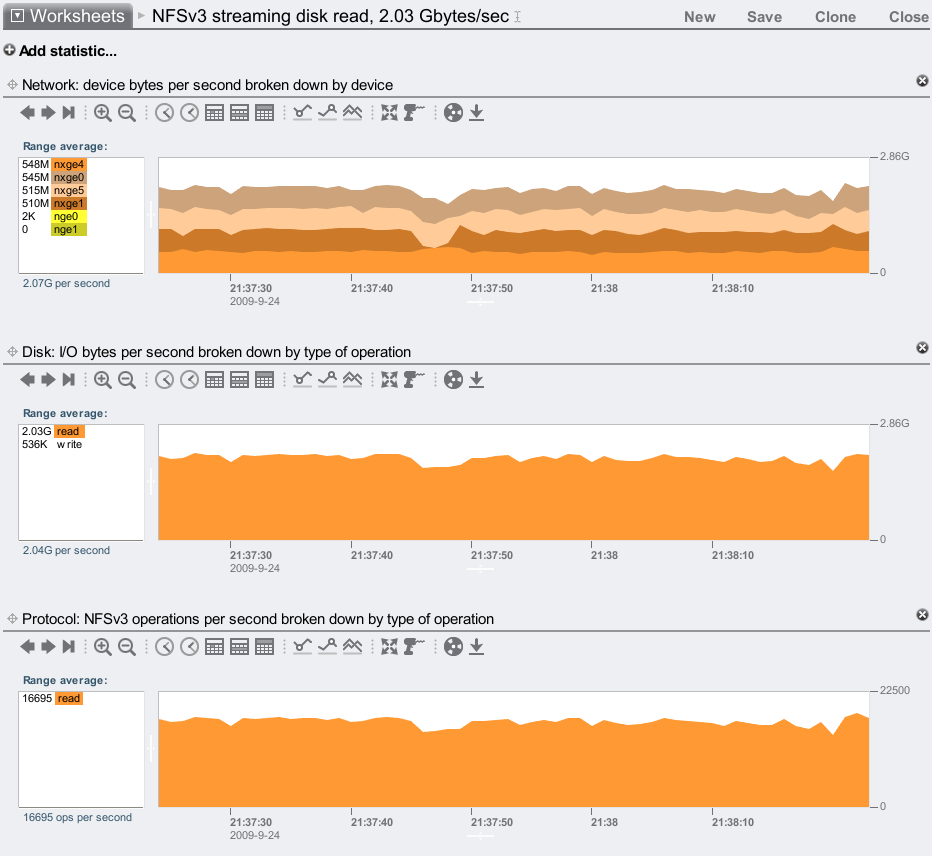
We are pulling 2.03 Gbytes/sec from disk, which is mostly payload (plus ZFS metadata); once it goes over the wire it is 2.07 Gbytes/sec (with NFS headers.) Over 2 Gbytes/sec is a great result, almost double what the Barcelona 7410 could do.
This was tested using two streaming read threads per client, on 20 clients, with a 1 Mbyte I/O size.
Max NFSv3 streaming disk write
Now for a streaming write test to the 7410, running two write threads across 10 of the clients:
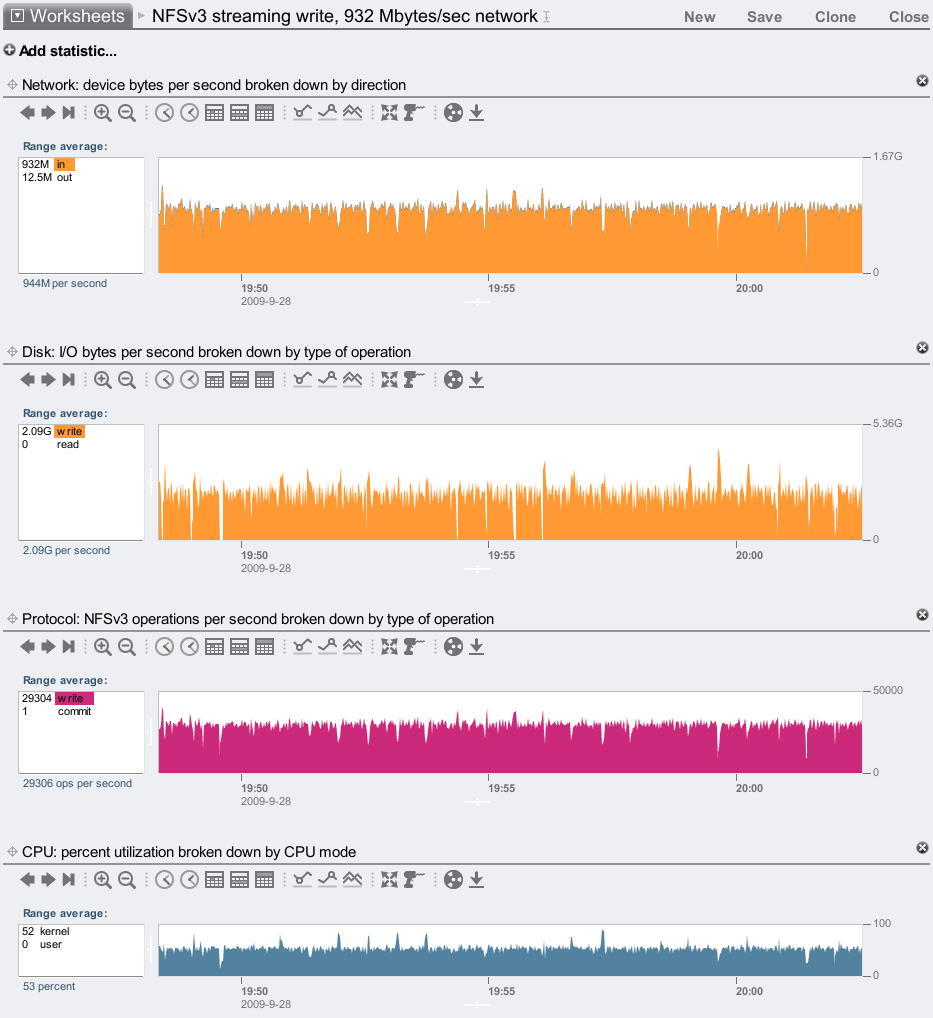
932 Mbytes/sec over the network, and over double when it reaches disk due to mirroring ((932 + metadata) x 2). I've zoomed out to take a 15 minute average, as writes can be variable (for reasons on both the server and clients) and I didn't want to include an unfairly high or low 1 minute average.
This is a great result, and getting close to 1 Gbyte/sec write. I think I could go faster with some better clients, and possibly break 1 Gbyte/sec.
Max NFSv3 read ops/sec
Now for an IOPS test: to find the upper bound of IOPS, I'll test cached 1 byte reads over NFSv3. The clients run hundreads of threads to request as many IOPS as the 7410 can serve:
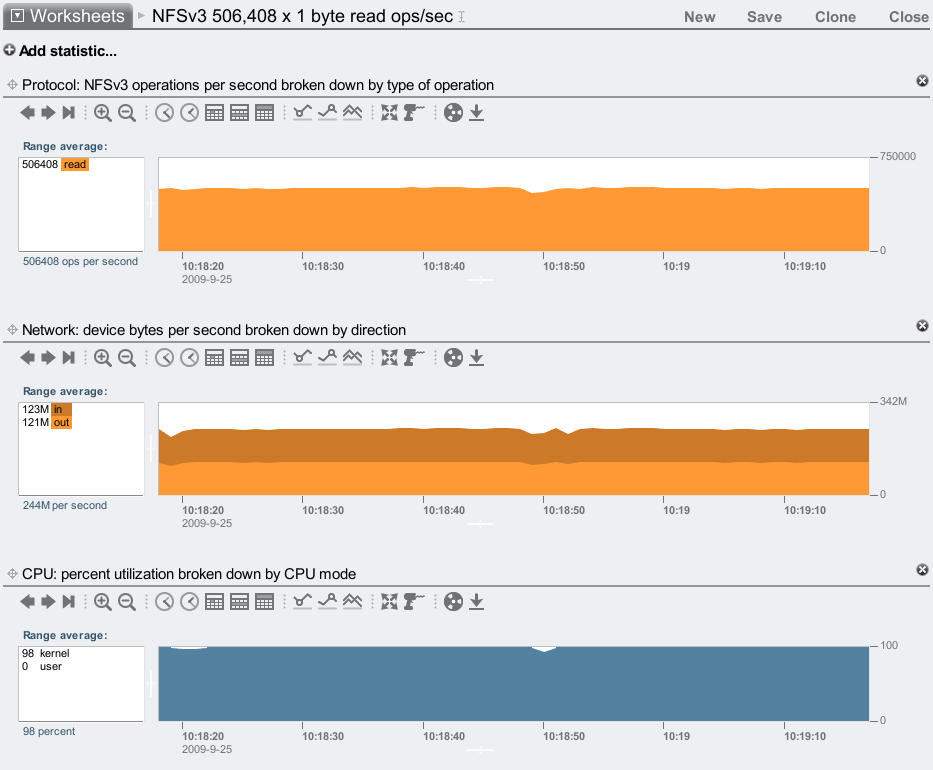
Half a million from a single head node. Not a cluster (some vendors like to multiply their results by the max heads in a cluster). Yes, this is 1 byte reads, but the performance is still solid when they increase in size.
Here's my swing at cached 4 Kbyte NFS I/O:
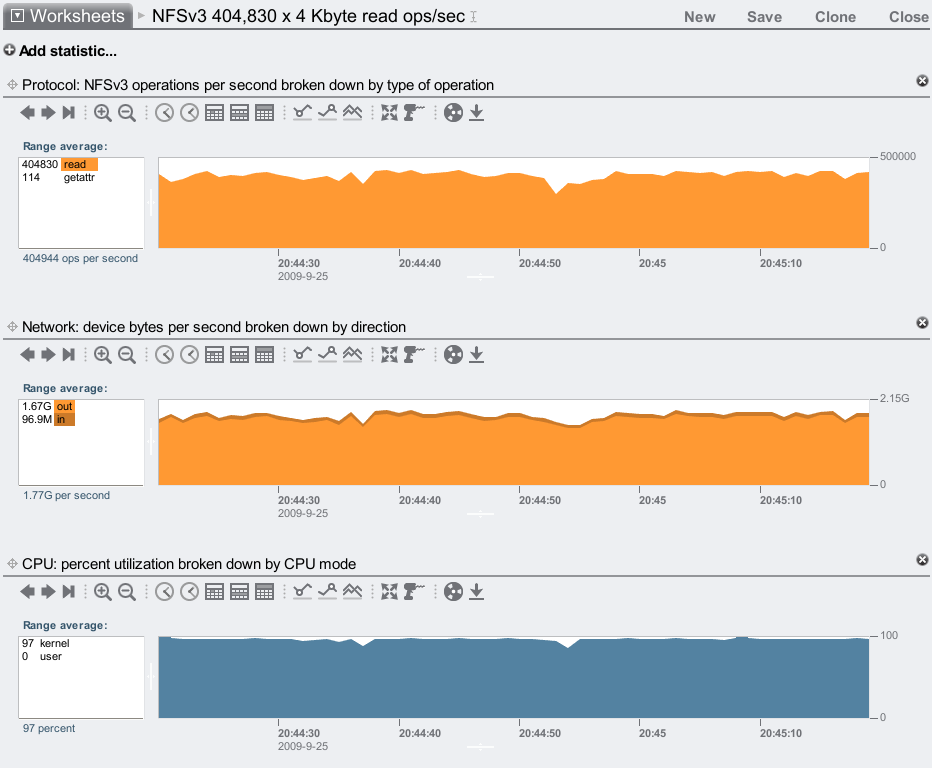
Over 400K! This result may be more impressive (and practical) than reaching half a million 1 byte IOPS.
Configuration
As the filer I was using a single Sun Storage 7410, with the following config:
- 256 Gbytes DRAM
- 8 JBODs, each with 24 x 1 Tbyte disks, configured with mirroring
- 4 sockets of six-core AMD Opteron 2600 MHz CPUs (Istanbul)
- 2 x 2x10 GbE cards (4 x 10 GbE ports total), jumbo frames
- 3 x HBA cards
- noatime on shares, and database size left at 128 Kbytes
It's not a max config system: the 7410 can currently scale to 12 JBODs and have flash based SSD as read cache and intent log, which I'm not using for these tests.
The clients are 20 blades, each:
- 2 sockets of Intel Xeon quad-core 1600 MHz CPUs
- 3 Gbytes of DRAM
- 2 x 1 GbE network ports
- mount options:
- read tests: mounted forcedirectio (to skip client caching), and rsize to match the workload
- write tests: default mount options
These clients are great, apart from the CPU clock speed, which at 1600 MHz is a little low.
The network consists of multiple 10 GbE switches to connect the client 1 GbE ports to the filer 10 GbE ports.
Conclusion
For this 7410 upgrade, the extra CPU cores help, but it's more about the upgrade to the HyperTransport. HT3 provides 3x the CPU interconnect bandwidth, and dramatically improves the delivered performance of the 7410: from 25% to 75%. The 7410 was already a powerful server, it's now raised the bar even higher.