

There's an arms race to add eBPF to commercial observability products, and in this post I'll describe how to quickly do that. This is also applicable for people adding it to their own in-house monitoring systems.
People like to show me their BPF observability products after they have prototyped or built them, but I often wish I had given them advice before they started. As the leader of BPF observability, it's advice I've been including in recent talks, and now I'm including it in this post.
First, I know you're busy. You might not even like BPF. To be pragmatic, I'll describe how to spend the least effort to get the most value. Think of this as "version 1": A starting point that's pretty useful. Whether you follow this advice or not, at least please understand it to avoid later regrets and pain.
If you're using an open source monitoring platform, first check if it already has a BPF agent. This post assumes it doesn't, and you'll be adding something for the first time.
1. Run your first tool
Start by installing the bcc or bpftrace tools. E.g., bcc on Ubuntu:
# apt-get install bpfcc-tools
Then try running a tool. E.g., to see process execution with timestamps using execsnoop(8):
# execsnoop-bpfcc -T
TIME     PCOMM            PID    PPID   RET ARGS
19:36:15 service          828567 6009     0 /usr/sbin/service --status-all
19:36:15 basename         828568 828567   0
19:36:15 basename         828569 828567   0 /usr/bin/basename /usr/sbin/service
19:36:15 env              828570 828567   0 /usr/bin/env -i LANG=en_AU.UTF-8 LANGUAGE=en_AU:en LC_CTYPE= LC_NUMERIC= LC_TIME= LC_COLLATE= LC_MONETARY= LC_MESSAGES= LC_PAPER= LC_NAME= LC_ADDRESS= LC_TELEPHONE= LC_MEASUREMENT= LC_IDENTIFICATION= LC_ALL= PATH=/opt/local/bin:/opt/local/sbin:/usr/local/git/bin:/home/bgregg/.local/bin:/home/bgregg/bin:/opt/local/bin:/opt/local/sbin:/ TERM=xterm-256color /etc/init.d/acpid
19:36:15 acpid            828570 828567   0 /etc/init.d/acpid status
19:36:15 run-parts        828571 828570   0 /usr/bin/run-parts --lsbsysinit --list /lib/lsb/init-functions.d
19:36:15 systemctl        828572 828570   0 /usr/bin/systemctl -p LoadState --value show acpid.service
19:36:15 readlink         828573 828570   0 /usr/bin/readlink -f /etc/init.d/acpid
[...]
While basic, I've solved many perf issues with this tool alone, including for misconfigured systems where a shell script is launching failing processes in a loop, and when some minor application is crashing and is restarting every few minutes but has not yet been noticed.
2. Add a tool to your product
Now imagine adding execsnoop(8) to your product. You likely already have agents running on all your customer systems. Do they have a way to run a command and return the text output? Or run a command and send the output elsewhere for aggregation (S3, Hive, Druid, etc.)? There are so many options it's really your own preference based on your existing system and customer environments.
When you add your first tool to your product, have it run it for a short duration such as 10 to 60 seconds. I just noticed execsnoop(8) doesn't have a duration option yet, so in the interim you could wrap it with watch -s2 60 execsnoop-bpfcc. If you want to run these tools 24x7, study overheads to understand the cost first. Low frequency events such as process execution should be negligible to capture.
Instead of bcc, you can also use the bpftrace versions. These typically don't have canned options (-v, -l, etc.), but do have a json output mode. E.g.:
# bpftrace -f json execsnoop.bt
{"type": "attached_probes", "data": {"probes": 2}}
{"type": "printf", "data": "TIME(ms)   PID   ARGS\n"}
{"type": "printf", "data": "2737       849176 "}
{"type": "join", "data": "ls -F"}
{"type": "printf", "data": "5641       849178 "}
{"type": "join", "data": "date"}
This mode was added so that BPF observability products can be built on top of bpftrace.
3. Don't worry about dependencies
I am indeed suggesting that you install bcc or bpftrace on your customer systems, and they currently have llvm dependencies. This can add up to tens of Mbytes, which can be a problem for some resource-constrained environments (embedded). We've been doing lots of work to fix this in the future. bcc has newer versions of the tools (libbpf-tools) that use BTF and CO-RE (and not Python) and will ultimately mean you can install 100-Kbyte binary versions of the tools with no dependencies. bpftrace has a similar plan to produce a small dependency-less binary using the newer kernel features.
This does require at least Linux 5.8 to work well, and your customers may not run that for years. In the interim I'd suggest not worrying about the llvm dependencies for now since it will be fixed later.
Note that not all Linux distributions have enabled CONFIG_DEBUG_INFO_BTF=y, which is necessary for the future of BTF and CO-RE. Major distros have set it, such as in Ubuntu 20.10, Fedora 30, and RHEL 8.2. But if you know some of your customers are running something uncommon, please check and encourage them or the distro vendor to set CONFIG_DEBUG_INFO_BTF=y and CONFIG_DEBUG_INFO_BTF_MODULES=y to avoid pain in the future.
4. Version 1 dashboard
Now you have one BPF observability tool in your product, it's time to add more. Here are the top ten tools you can run and present as a generic BPF observability dashboard, along with suggested visualizations:
| Tool | Shows | Visualization | |
|---|---|---|---|
| 1. | execsnoop | New processes (via exec(2)) | table |
| 2. | opensnoop | Files opened | table |
| 3. | ext4slower | Slow filesystem I/O | table |
| 4. | biolatency | Disk I/O latency histogram | heat map |
| 5. | biosnoop | Disk I/O per-event details | table, offset heat map |
| 6. | cachestat | File system cache statistics | line charts |
| 7. | tcplife | TCP connections | table, distributed graph |
| 8. | tcpretrans | TCP retransmissions | table |
| 9. | runqlat | CPU scheduler latency | heat map |
| 10. | profile | CPU stack trace samples | flame graph |
This is based on my bcc Tutorial, and many also exist in bpftrace. I chose these to find the most performance wins with the fewest tools.
Note that runqlat and profile can have noticable overheads, so I'd run these tools for between 10 and 60 seconds only and generate a report. Some are low enough overhead to be run 24x7 if desired (e.g., execsnoop, biolatency, tcplife, tcpretrans).
There is already documentation as man pages and example files in the bcc and bpftrace repositories that you can link to, to help your customers understand the tool output. E.g., here's the execsnoop(8) example files in bcc and bpftrace.
Once you have this all working, you have version 1!
bcc vs bpftrace
The bcc tools are the easiest to use, as they usually have many command-line options. The bpftrace tools are easier to edit and customize, and bpftrace has a json output mode.
If you're completely new to tracing, go with bcc. If you want to do some hacking and customizing of the tools, go with bpftrace. In the end, they are both good options.
Case study: Netflix
Netflix is building a new GUI that does this tool dashboard and more, based on the bpftrace versions of these tools. The architecture is:
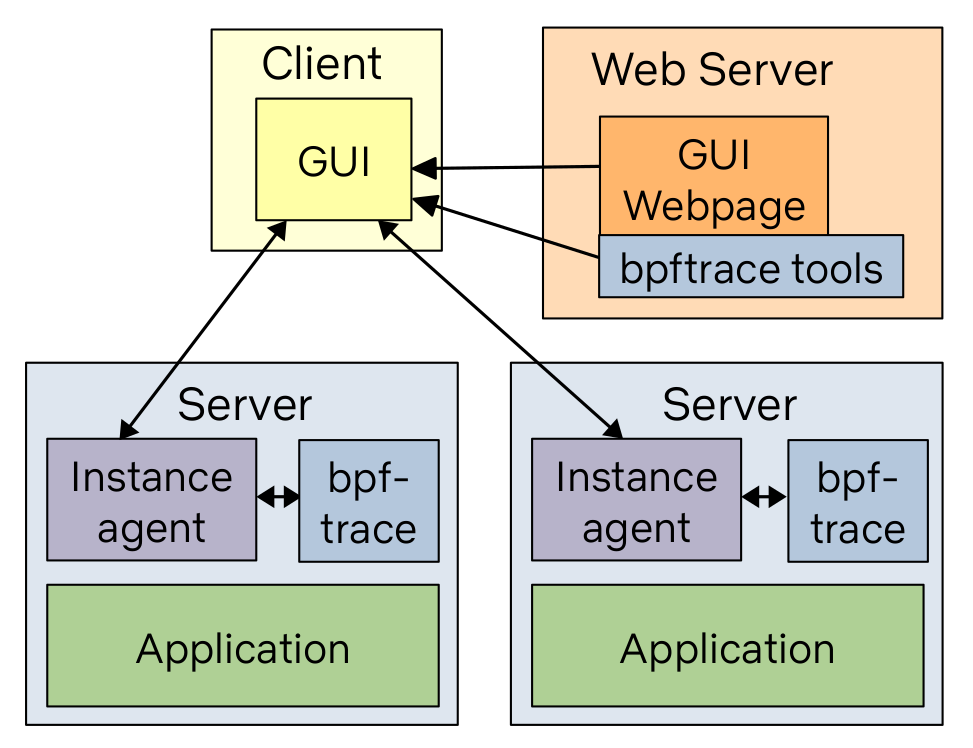
While the bpftrace binary is installed on all the target systems, the bpftrace tools (text files) live on a web server and are pushed out when needed. This means we can ensure we're always running the latest version of the tools by updating them in one place.
This is currently part of our FlameCommander UI, which also runs flame graphs across the cloud. Our previous BPF GUI was part of Vector, and used bcc, but we've since deprecated that. We'll likely open source the new one at some point and have a post about it on the Netflix tech blog.
Case study: Facebook
Facebook are advanced users of BPF, but deep details of how they run the tools fleet-wide aren't fully public. Based on the activity in bcc, and their development of the BTF and CO-RE technologies, I'd strongly suspect their solution is based on the bcc libbpf-tool versions.
Porting Pitfalls
BPF tracing tools are like application and kernel patches. They need constant updates to keep working across different software versions. Porting them to a different language and then not maintaining them may be like trying to apply a Linux 4.15 patch to Linux 5.12. If you're lucky, it blows up! If you're unlucky, the patch applies but corrupts some things in a subtle way that you don't notice until later. It depends on the tool.
As an extreme example, I wrote cachestat(8) while on vacation in 2014 for use on the Netflix cloud, which was a mix of Linux 3.2 and 3.13 at the time. BPF didn't exist on those versions, so I used basic Ftrace capabilities that were available on Linux 3.2. I described this approach as brittle and a sandcastle that would need maintenance as the kernel changed. It was later ported to BPF with kprobes, and has now been rewritten and included in commercial observability products. Unsurprisingly, I've heard it has problems on newer kernels, printing output that doesn't make sense. It really needs an overhaul. When I (or someone) does, anyone pulling updates from bcc will automatically get the fixed version, no effort. Those that have rewritten it will need to rewrite theirs. I fear they won't, and customers will be running a broken version of cachestat(8) for years.
Note that if BPF was available on my target environment when I wrote cachestat(8), I would have coded it completely differently. People are porting something written for Linux 3.2 and running it on Linux 5.x.
In a previous blog post, An Unbelievable Demo, I talked about how something similar happened many years ago where old tracing tool versions were used without updates.
The problems I'm describing are specific to BPF software and kernel tracing. As a different example, my flame graph software has been rewritten over a dozen times, and since it's a simple and finished algorithm I don't see a big problem with that. I prefer people help with the newer d3 version, but if people do their own it's no big deal. You can code it and it'll work forever. That's not the case with uprobe- and kprobe-based BPF tools, because they do need maintenance.
Think like a sysadmin, not like a programmer
In summary, start by checking if there's already a BPF agent for your monitoring systems, and if not, build one based on the existing bcc or bpftrace tools rather than rewriting everything from scratch. This is thinking like a sysadmin who installs and maintains software, and not like a programmer who codes everything. Install the bcc or bpftrace tools, add them to your observability product, and pull package updates as needed. That will be a quick and useful version 1. BPF up and running!
I see people think like a programmer instead and feel they must start by learning bcc and BPF programming in depth. Then, having discovered everything is C or Python, some rewrite it all in a different language.
First, learning bcc and BPF well takes weeks; Learning the subtleties and pitfalls of system tracing can take months or years. To give you a taste of what you're in for, check out my BPF Internals talk. If you really want to do this and have the time, you certainly can (you'll probably wind up at tracing conferences and bumping into me: See you at Linux Plumber's or the Tracing Summit!) But if you're under some deadline to add BPF observability, try thinking like a sysadmin instead and just build upon the existing tools. That's the fast way. Think like a programmer later, if or when you have the time.
Second, the BPF software, especially certain kprobe-based tools, require ongoing maintenance. A tool may work on Linux 5.3 but break on 5.4, as a traced function was renamed or a new code path added. The BPF libraries and frameworks are also changing and evolving, most recently with the BTF and CO-RE support. This is something I hope people consider before choosing to rewrite them: Do you have a plan to rewrite all the updates as well, or will you end up stuck on an old port of the library? It's easier to pull updates of everything than to maintain your own versions.
Finally, what if you have a great idea for a better BPF library or framework than what we're using in bcc and bpftrace? Talk to us, try it out, innovate. We're at the start of the BPF era and there's lots more to explore. But please understand what exists first and the maintenance burden you are taking on. Your energies may be better spent creating something new, on top of what exists, than porting something old.
Click here for Disqus comments (ad supported).