

Here's a simple example of Linux perf_events static tracepoints: tracing disk I/O.
We'll do this using the block I/O tracepoints. There are many to choose from, and these can show fine detail of what your storage devices have been asked to do, and how they are performing. Listing the tracepoints:
# sudo perf list 'block:*'
  block:block_touch_buffer                           [Tracepoint event]
  block:block_dirty_buffer                           [Tracepoint event]
  block:block_rq_abort                               [Tracepoint event]
  block:block_rq_requeue                             [Tracepoint event]
  block:block_rq_complete                            [Tracepoint event]
  block:block_rq_insert                              [Tracepoint event]
  block:block_rq_issue                               [Tracepoint event]
  block:block_bio_bounce                             [Tracepoint event]
  block:block_bio_complete                           [Tracepoint event]
  block:block_bio_backmerge                          [Tracepoint event]
[...]
These are only visible to the root user. I'll use block_rq_complete, which traces I/O completions, and trace it for 10 seconds. This writes events ("samples") to a perf.data file, which I'll then print:
# sudo perf record -e block:block_rq_complete -a sleep 10
[ perf record: Woken up 1 times to write data ]
[ perf record: Captured and wrote 0.428 MB perf.data (~18687 samples) ]
# sudo perf script
        run 30339 [000] 2083345.722767: block:block_rq_complete: 202,1 W () 12984648 + 8 [0]
        run 30339 [000] 2083345.722857: block:block_rq_complete: 202,1 W () 12986336 + 8 [0]
        run 30339 [000] 2083345.723180: block:block_rq_complete: 202,1 W () 12986528 + 8 [0]
    swapper     0 [000] 2083345.723489: block:block_rq_complete: 202,1 W () 12986496 + 8 [0]
    swapper     0 [000] 2083346.745840: block:block_rq_complete: 202,1 WS () 1052984 + 144 [0]
  supervise 30342 [000] 2083346.746571: block:block_rq_complete: 202,1 WS () 1053128 + 8 [0]
  supervise 30342 [000] 2083346.746663: block:block_rq_complete: 202,1 W () 12986608 + 8 [0]
        run 30342 [000] 2083346.747003: block:block_rq_complete: 202,1 W () 12986832 + 8 [0]
[...]
I traced this on an AWS EC2 instance, so these are virtual disk devices. Virtual disks can exhibit slower I/O due to virtualization overheads, and higher variance due to neighbors, so any information that can help us tune and reduce I/O can be even more important here than on bare-metal systems.
Each disk I/O completion is shown as a line of output. The 4th and 5th columns are obvious: a timestamp (in seconds) and tracepoint description. The first few columns are some bonus info: the on-CPU command and PID, and the CPU number that hit the tracepoint.
The remaining columns (6+), show details on the block I/O. For example, reading the first line:
- 202,1: storage device major and minor number
- W: type of I/O (W=write, R=read, A=readahead, S=sync, ...)
- (): can contain block command details (eg, SCSI command in hex)
- 12984648: storage device offset
- 8: size of I/O (in sectors)
- [0]: errors
This is really convenient, and a similar string of goodies is baked into all static tracepoints. Of course, if you want to access this in binary, or access custom data, you can do that too.
Note that the tracepoint strings can change between kernel versions, so if you start consuming these you'll need to watch out for changes. Here's where this example comes from in the 3.14.5 kernel source:
include/trace/events/block.h:
TRACE_EVENT(block_rq_complete,
[...]
        TP_printk("%d,%d %s (%s) %llu + %u [%d]",
                  MAJOR(__entry->dev), MINOR(__entry->dev),
                  __entry->rwbs, __get_str(cmd),
                  (unsigned long long)__entry->sector,
                  __entry->nr_sector, __entry->errors)
You can also dump the tracepoint format file as a reminder:
# sudo cat /sys/kernel/debug/tracing/events/block/block_rq_complete/format
name: block_rq_complete
ID: 942
format:
    field:unsigned short common_type;   offset:0;   size:2; signed:0;
    field:unsigned char common_flags;   offset:2;   size:1; signed:0;
    field:unsigned char common_preempt_count;   offset:3;   size:1; signed:0;
    field:int common_pid;   offset:4;   size:4; signed:1;

    field:dev_t dev;    offset:8;   size:4; signed:0;
    field:sector_t sector;  offset:16;  size:8; signed:0;
    field:unsigned int nr_sector;   offset:24;  size:4; signed:0;
    field:int errors;   offset:28;  size:4; signed:1;
    field:char rwbs[8]; offset:32;  size:8; signed:1;
    field:__data_loc char[] cmd;    offset:40;  size:4; signed:1;

print fmt: "%d,%d %s (%s) %llu + %u [%d]", ((unsigned int) ((REC->dev) >> 20)), ((unsigned int) ((REC->dev) & ((1U << 20) - 1))), REC->rwbs, __get_str(cmd), (unsigned long long)REC->sector, REC->nr_sector, REC->errors
This ends with the format string that perf_events reads by default.
perf_events can do more than just capture this tracepoint and its format string: it can also capture stack traces that led to the event, and perform custom in-kernel filtering as desired.
Apart from block I/O, there are also static tracepoints for many areas of the Linux kernel:
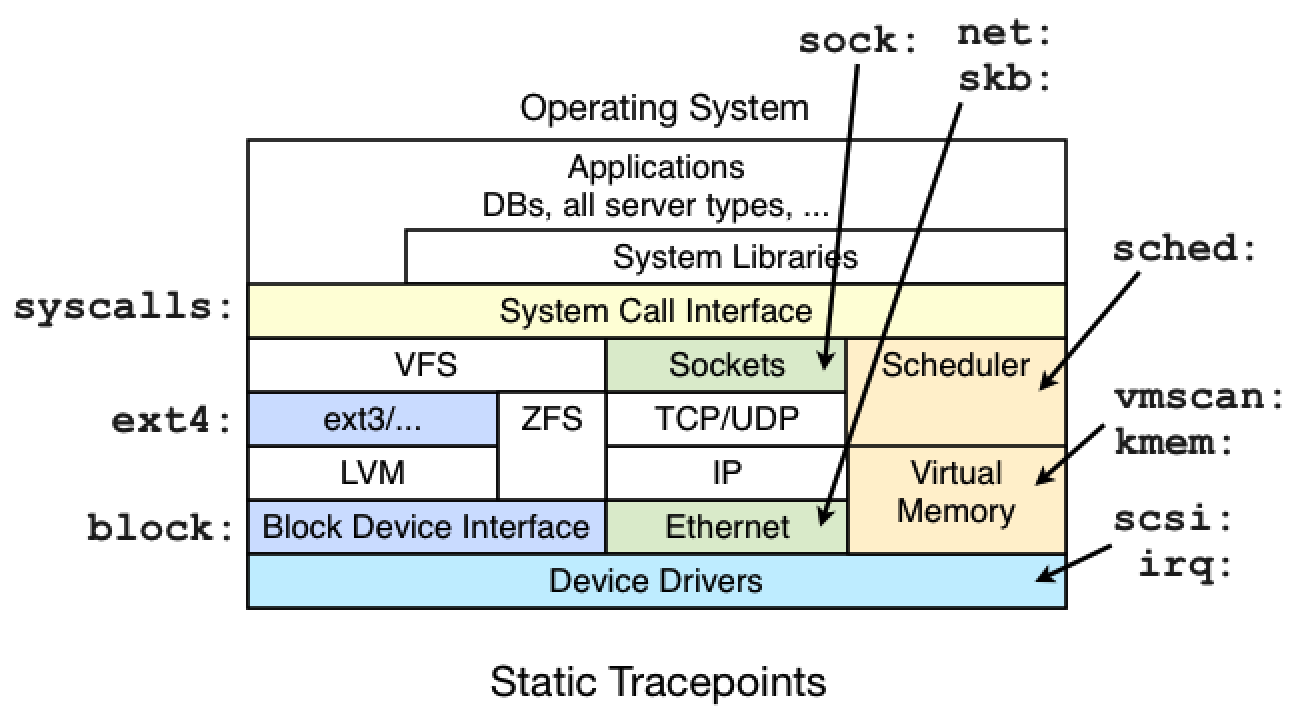
You can also use perf_events to create dynamic tracepoints (dynamic tracing), to see areas not covered with a static tracepoint. The possibilities are endless.
See my perf_events page for more examples, and my previous post on using perf_events for CPU sampling.
Click here for Disqus comments (ad supported).