

This is disk latency of an AWS EC2 c3.large instance (ubuntu), shown as a latency heat map:
Woah, aren't these disks supposed to be SSDs?
Mouse over pixels for details. Here is the SVG, and a zoomed SVG to 15ms. Time is on the x-axis, and latency on the y-axis. The color shows how many I/O fell into that time and latency range: darker for more.
There is a latency spike at the 63 second mark, which exceeds 237 ms. Yikes. Around the 43 second mark a cloud of latency begins, reaching around 30 ms, which is also worrying for SSDs.
Perhaps there is a simple explanation: load. Bursts of I/O could cause the spikes, thanks to queueing on the device. And the latency cloud could be explained by an increase in the rate of requested I/O at the 43 second mark. I generated line graphs to check these theories:
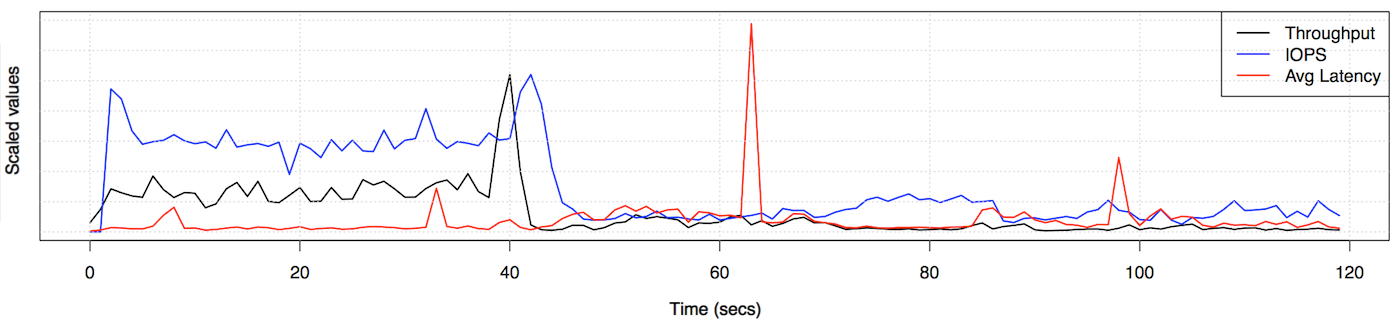
This shows no workload bursts or increases that would explain the changes in latency.
I was creating an example of a disk latency heat map, and as a simple workload I ran tar(1) to archive the entire system. This turned out to be more than I had bargained for. Explaining it is pretty interesting, and demonstrates the different types of disk I/O heat maps you can generate on Linux.
Latency Heat Map Generation
In my previous post on Linux perf static tracepoints, I showed how the block:block_rq_complete probe provided a wealth of useful info by default. Along with the block:block_rq_issue probe, you can use the issue to complete tracepoint timestamps to calculate I/O time, or "latency".
Here's how I captured the disk events:
# perf record -e block:block_rq_issue -e block:block_rq_complete -a sleep 120
[ perf record: Woken up 217 times to write data ]
[ perf record: Captured and wrote 54.507 MB perf.data (~2381448 samples) ]
# perf script > out.blockio
# more out.blockio
     tar 16072 [001] 2199495.030133: block:block_rq_issue: 202,16 R 0 () 21997888 + 8 [tar]
 swapper     0 [000] 2199495.030286: block:block_rq_complete: 202,16 R () 21997888 + 8 [0]
     tar 16072 [001] 2199495.030327: block:block_rq_issue: 202,16 R 0 () 21997896 + 8 [tar]
 swapper     0 [000] 2199495.030512: block:block_rq_complete: 202,16 R () 21997896 + 8 [0]
[...]
This uses perf to instrument both tracepoints for 120 seconds, then dumps the capture file to out.blockio: a text file of the data.
Here's the commands I used to generate the previous heatmaps. This includes trace2heatmap.pl, which you can download from my github HeatMap project.
$ awk '{ gsub(/:/, "") } $5 ~ /issue/ { ts[$6, $10] = $4 }
    $5 ~ /complete/ { if (l = ts[$6, $9]) { printf "%.f %.f\n", $4 * 1000000,
    ($4 - l) * 1000000; ts[$6, $10] = 0 } }' out.blockio > out.lat_us
$ ./trace2heatmap.pl --unitstime=us --unitslat=us --grid out.lat_us > out.lat.svg
$ ./trace2heatmap.pl --unitstime=us --unitslat=us --grid --maxlat=15000 \
    --title="Latency Heat Map: 15ms max" out.lat_us > out.latzoom.svg
The trace2heatmap.pl program takes two columns: a timestamp and a latency. I used awk to associate block_rq_issue timestamps with block_rq_complete, based on the device ID and offset, so that latency can be calculated from their timestamps.
You might need to adjust the field numbers ($4, $5, ...) to match your output, as the perf_events tracepoints can change between kernel versions. This kernel version is 3.14.5.
If you want, you can combine steps to skip the intermediate files. I find them handy to browse, to look for patterns event by event.
Size Heat Map
There are two main workload factors that cause SSDs to perform differently: reads vs writes, and I/O size. As this is archiving an entire system, it might have encountered larger files at the 43 second mark, changing the I/O sizes used.
I/O size information is part of the capture I already have: field 11, in sectors. Building an I/O size heat map:
$ awk '{ gsub(/:/, "") } $5 ~ /complete/ { print $4 * 1000000, ($11 * 512) }' \
    out.blockio > out.sizes
$ ./trace2heatmap.pl --unitstime=us --unitslat=bytes out.sizes \
    --title="Size Heat Map" > out.sizes.svg
Produces (SVG):
The y-axis is now I/O size. In this case, that's not consistent with the latency seen. I/O size actually tends to be smaller after 43 seconds, not larger, which should mean quicker I/O...
Offset Heat Map
It's worth showing the following while I'm here, although it shouldn't make much difference for SSDs: the disk I/O offset heat map. This uses the sector offset field from the block_rq_complete probe.
$ awk '{ gsub(/:/, "") } $5 ~ /complete/ { print $4 * 1000000, ($9 * 512) / (1024 * 1024) }' \
    out.blockio > out.offset
$ ./trace2heatmap.pl --unitstime=us --unitslat=Mbytes out.offset \
    --title="Offset Heat Map" > out.offset.svg
Produces (SVG):
You can use this to quickly identify random disk I/O vs sequential, based on the spread of the offset distribution. For rotational disks this can make a 10x difference to the delivered latency (although to do this properly, you should generate a heat map for each disk). For SSDs it shouldn't matter: no mechanical disk arm to move, or platter to wait for rotation.
Something does happen at the 43 second mark. Before that, I/O looks quite random across the 16 Gbyte range (size of each SSD). After that, the pattern shows more sequential components. In fact, it looks a bit like a file system optimizing placement for rotational disks. Am I sure that I'm only looking at SSDs here?
SSD Latency Only
My archive workload read all file systems, including the boot drive. For this instance, that's rotational magnetic disks. I can exclude it from my heat map by filtering the device ID, which was "202,1" (you'll need to adjust this to match your instance type):
$ awk '{ gsub(/:/, "") } $5 ~ /issue/ && $6 != "202,1" { ts[$6, $10] = $4 }
    $5 ~ /complete/ { if (l = ts[$6, $9]) { printf "%.f %.f\n", $4 * 1000000,
    ($4 - l) * 1000000; ts[$6, $10] = 0 } }' out.blockio > out.ssd_lat
$ ./trace2heatmap.pl --unitstime=us --unitslat=us \
    --title="Latency Heat Map: SSDs only" out.ssd_lat > out.ssd.svg
This produces a heat map that shows SSD I/O only (SVG):
All right! So the latency cloud and spikes after 43 were fore rotational disk I/O only, not SSD.
Read Latency Only
I've seen such latency spikes before, caused by flushing batches of writes. Filtering out writes:
$ awk '{ gsub(/:/, "") } $5 ~ /issue/ && $7 ~ /R/ { ts[$6, $10] = $4 }
    $5 ~ /complete/ { if (l = ts[$6, $9]) { printf "%.f %.f\n", $4 * 1000000,
    ($4 - l) * 1000000; ts[$6, $10] = 0 } }' out.blockio > out.read_lat
$ ./trace2heatmap.pl --unitstime=us --unitslat=us out.read_lat > out.read.svg
Produces (SVG):
Ah, latency spikes gone. These are bursts of writes, likely file system flushes. Also notice that the reads were unaffected: what's likely happening is that the disk devices are prioritizing reads over writes.
Conclusion
While the main storage on my c3.large is SSDs, my example workload accessed the rotational boot disk, changing the latency distribution dramatically. It's an easy configuration mistake to watch out for. There were also occasions where bursts of writes to this disk occurred, likely file system flushes, causing spikes in latency. These are normal, and usually don't affect synchronous I/O (drives can queue and service these differently).
These behaviors were visualized using heat maps for latency, I/O size, and I/O offset. These were generated using Linux perf_events to capture disk I/O events, some awk to process the output, and my heat map (github) software. You can do this too. Usual warning applys about running commands as root in production: understand what you are doing first.
Click here for Disqus comments (ad supported).