

I gave a talk at JavaOne last week on flame graphs (slides here), and in Q&A was asked about Java warmup. I wanted to show some flame graphs that illustrated it, but didn't have them on hand. Here they are.
These are 30 second flame graphs from a Java microservice warming up and beginning to process load. The following 30 flame graphs (3 rows of 10) have been shrunk too small to read the frames, but at this level you can see how processing changes in the first 10 minutes then settles down. Click to zoom (a little):
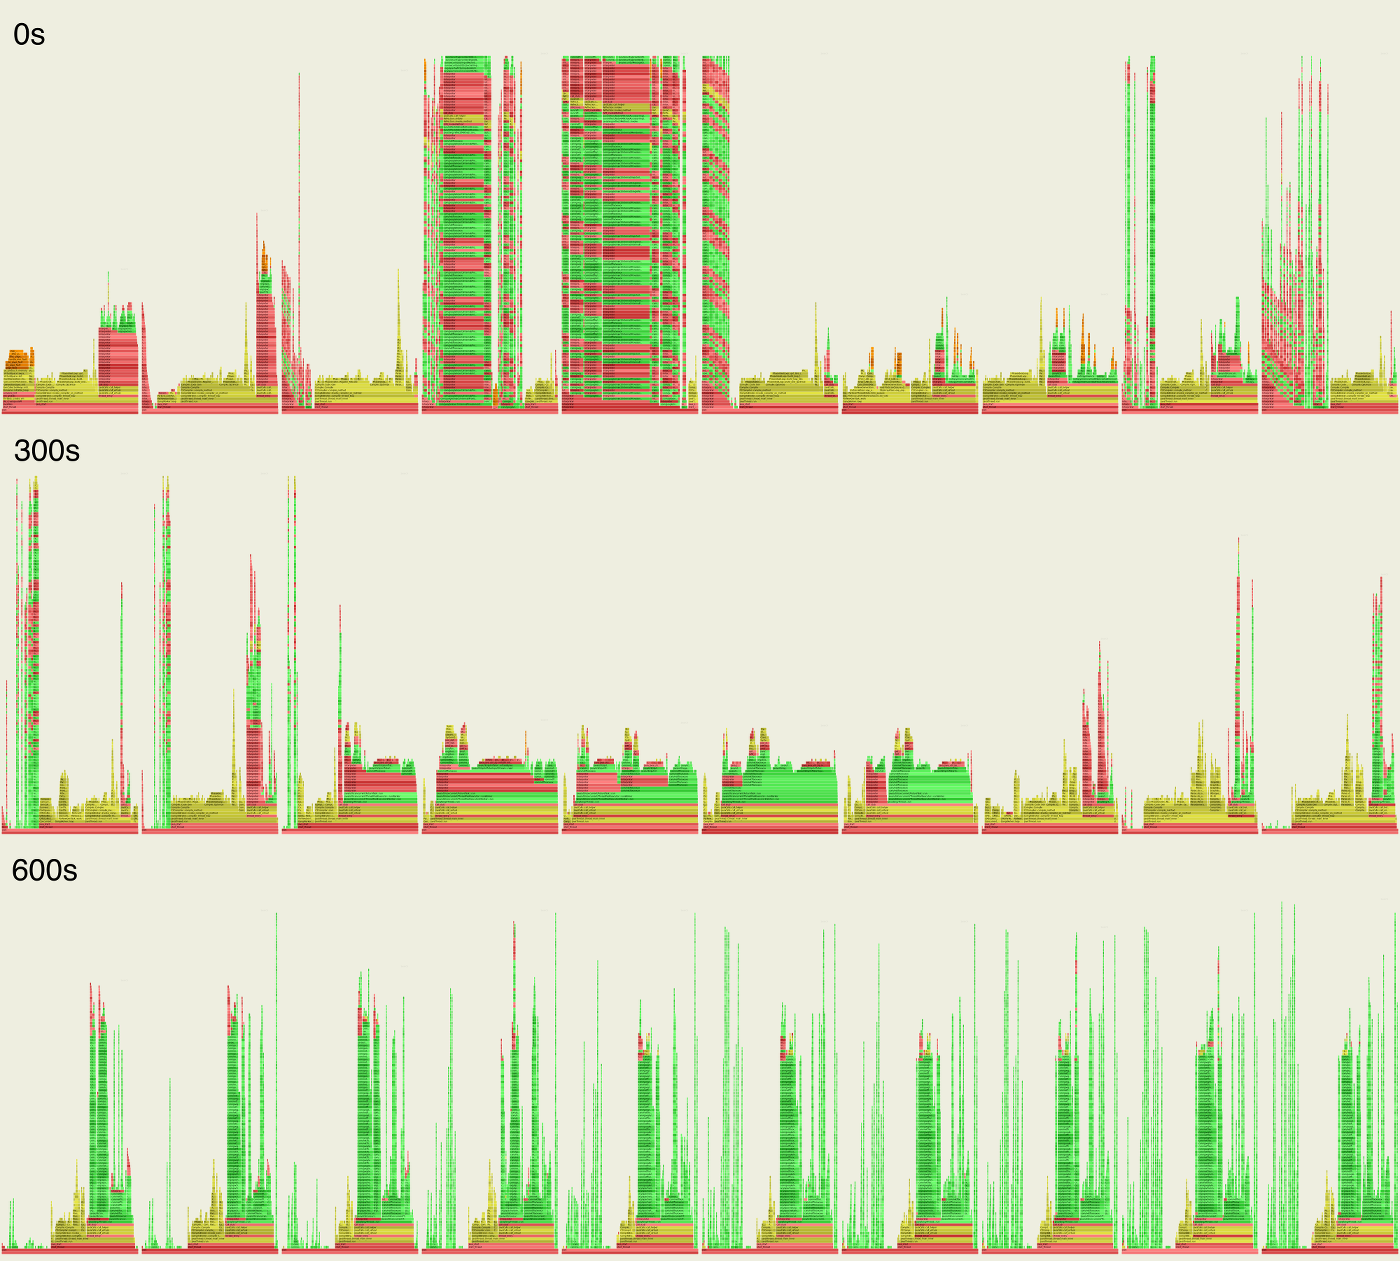
The hues are: yellow is C++, green is Java methods, orange is kernel code, and red is other user-level code. I'm using the Linux perf profiler, which can see everything, including kernel code execution with Java context. JVM profilers (which are what almost everyone is using) cannot do this, and have blind spots.
Now I'll zoom in to the first two:
Time = 0 - 30s
This is the first 30 seconds of Java after launch.
On the left, the Java heap is being pre-allocated by the JVM code (C++, yellow). The os::pretouch_memory() function is triggering page faults (kernel code, orange). Click Universe::initialize_heap to get a breakdown of where time (CPU cycles) are spent. Neat, huh?
Because you're probably wondering, here's clear_page_c_c() from arch/x86/lib/clear_page_64.S:
ENTRY(clear_page_c_e)
    movl $4096,%ecx
    xorl %eax,%eax
    rep stosb
    ret
ENDPROC(clear_page_c_e)
It uses REP and XORL instructions to wipe a page (4096 bytes) of memory. And that's a performance optimization added to Linux by Intel (Linux gets such micro-optimizations frequently). Now zoom back out using "Reset Zoom" (top left) or click a lower frame.
The tower on the right has many "Interpreter" frames in red (user-mode): these are Java methods that likely haven't hit the CompileThreshold tunable yet (by default: 10000). If these methods keep being called, they'll switch from being interpreted (executed by the JVM's "Interpreter" function) to being complied and executed natively. At that point, the compiled methods will be running from their own addresses which can be profiled and translated: in the Java flame graph, they'll be colored green.
The tower in the middle around C2Compiler::compile_method() shows the C2 compiler working on compiling Java just-in-time.
Time = 30 - 60s
We're done initializing the heap (that tower is now gone), but we're still compiling: about 55% of the CPU cycles are in the C2 compiler, and lots of Interpreter frame are still present. Click CompileBroker::compiler_thread_loop to zoom in to the compiler. I can't help but want to dig into these functions further, to look for optimizations in the compiler itself. Zooming back out...
There's a new tower, on the left, containing ParNewGenTask::work. Yes, GC has kicked in by the 30-60s profile. (Not all frames there are colored yellow, but they should be, it's just a bug in the flame graph software.)
See the orange frames in the top right? That's the kernel deleting files, called from java/io/UnixFileSystem:::delete0(). It's called so much that its CPU footprint is showing up in the profile. How interesting. So what's going on? The answer should be down the stack, but it's still Interpreter frames. I could do another warmup run and use my tracing tools (perf-tools or bcc). But right now I haven't done that so I don't know -- a mystery. I'd guess log rotation.
The frames with "[perf-79379.map]": these used to say "unknown", but a recent flame graph change defaults to the library name if the function symbol couldn't be found. In this case, it's not a library, but a map file which should have Java methods. So why weren't these symbols in it? The way I'm currently doing Java symbol translation is to take snapshots at the end of the profile, and it's possible those symbols were recompiled and moved by that point.
See the "Interpreter" tower on the far left? Notice how they don't begin with start_thread(), java_start(), etc? This is likely a truncated stack, due to the default setting of Linux perf to only capture the top 127 frames. Truncated stacks break flame graphs: it doesn't know where to merge them. This will be tunable in Linux 4.8 (kernel.perf_event_max_stack). I'd bed this tower really belongs on as part of the tallest Interpreter tower on the right -- if you can imagine moving the frames over there and making it wider to fit.
Time = 90+s
Going back to the montage, you can see different phases of warmup come and go, and different patterns of Java methods in green for each of them:
I was hoping to document and include more of the warmup, as each stage can be clearly seen and inspected (and there are more interesting things to describe, including a lock contention issue in CFLS_LAB::alloc() that showed up), but this post would get very long. I'll skip ahead to the warmed-up point:
Time = 600 - 630s
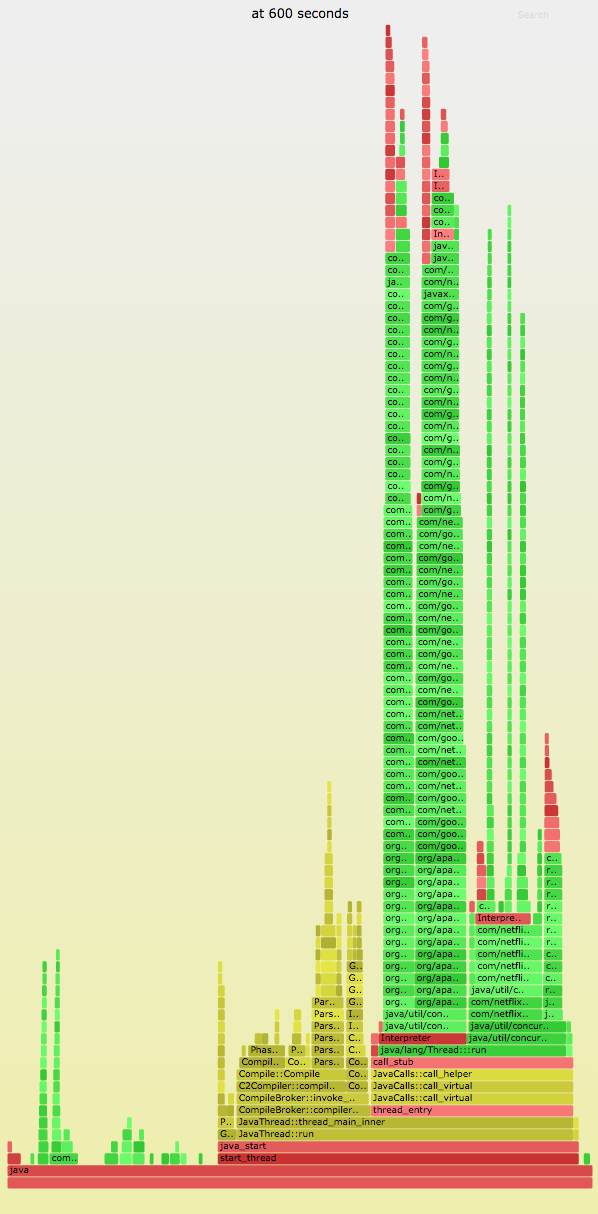
At the 10 minute mark, the microservice is running its production workload. Over time, the compiler tower shrinks further and we spend more time running Java code. (This image is a PNG, not a SVG.)
The small green frames on the left are more evidence of truncated stacks.
Generation
To generate these flame graphs, I ran the following the same moment I began load:
for i in `seq 100 130`; do perf record -F 99 -a -g -- sleep 30; ./jmaps
    perf script > out.perf_warmup_$i.txt; echo $i done; done
The jmaps program is an unsupported helper script for automating a symbol dump using Java perf-map-agent.
Then I post processed with the FlameGraph software:
for i in `seq 100 130`; do ./FlameGraph/stackcollapse-perf.pl --kernel \
    < out.perf_warmup_$i.txt | grep '^java' | grep -v cpu_idle | \
    ./FlameGraph/flamegraph.pl --color=java --width=800 --minwidth=0.5 \
    --title="at $(((i - 100) * 30)) seconds" > warmup_$i.svg; echo $i done; done
This is using the older way of profiling with Linux perf: via a perf.data file and "perf script". A newer way has been in development that uses BPF for efficient in-kernel summaries, but that's a topic for another post...
Click here for Disqus comments (ad supported).