

At the Linux Plumber's conference there were at least 24 talks on eBPF. It has quickly become not just an invaluable technology, but also an in-demand skill. Perhaps you'd like a new year's resolution: learn eBPF!
eBPF should stand for something meaningful, like Virtual Kernel Instruction Set (VKIS), but due to its origins it is extended Berkeley Packet Filter. It can be used for many things: network performance, firewalls, security, tracing, and device drivers. Some of these have plenty of free documentation online, like for tracing, and others not yet. The term tracing refers to performance analysis and observability tools that can produce per-event info. You may have already use a tracer: tcpdump and strace are specialized tracers.
In this post I'll cover learning eBPF for tracing, grouped into content for beginner, intermediate, and advanced users. In summary:
- Beginner: run bcc tools
- Intermediate: develop bpftrace tools
- Advanced: develop bcc tools, contribute to bcc & bpftrace
Update: I have a new book about eBPF tracing, published by Addison Wesley: BPF Performance Tools: Linux System and Application Observability.
Beginner
1. What is eBPF, bcc, bpftrace, and iovisor?
eBPF does to Linux what JavaScript does to HTML. (Sort of.) So instead of a static HTML website, JavaScript lets you define mini programs that run on events like mouse clicks, which are run in a safe virtual machine in the browser. And with eBPF, instead of a fixed kernel, you can now write mini programs that run on events like disk I/O, which are run in a safe virtual machine in the kernel. In reality, eBPF is more like the v8 virtual machine that runs JavaScript, rather than JavaScript itself. eBPF is part of the Linux kernel.
Programming in eBPF directly is incredibly hard, the same as coding in v8 bytecode. But no one codes in v8: they code in JavaScript, or often a framework on top of JavaScript (jQuery, Angular, React, etc). It's the same with eBPF. People will use it and code in it via frameworks. For tracing, the main ones are bcc and bpftrace. These don't live in the kernel code base, they live in a Linux Foundation project on github called iovisor.
2. What is an example of eBPF tracing?
This eBPF-based tool shows completed TCP sessions, with their process ID (PID) and command name (COMM), sent and received bytes (TX_KB, RX_KB), and duration in milliseconds (MS):
# tcplife
PID   COMM       LADDR           LPORT RADDR           RPORT TX_KB RX_KB MS
22597 recordProg 127.0.0.1       46644 127.0.0.1       28527     0     0 0.23
3277  redis-serv 127.0.0.1       28527 127.0.0.1       46644     0     0 0.28
22598 curl       100.66.3.172    61620 52.205.89.26    80        0     1 91.79
22604 curl       100.66.3.172    44400 52.204.43.121   80        0     1 121.38
22624 recordProg 127.0.0.1       46648 127.0.0.1       28527     0     0 0.22
3277  redis-serv 127.0.0.1       28527 127.0.0.1       46648     0     0 0.27
22647 recordProg 127.0.0.1       46650 127.0.0.1       28527     0     0 0.21
3277  redis-serv 127.0.0.1       28527 127.0.0.1       46650     0     0 0.26
[...]
eBPF did not make this possible – I can rewrite tcplife to use older kernel technologies. But if I did, we'd never run such a tool in production due to the performance overhead, security issues, or both. What eBPF did was make this tool practical: it is efficient and secure. For example, it does not trace every packet like older techniques, which can add too much performance overhead. Instead, it only traces TCP session events, which are much less frequent. This makes the overhead so low we can run this tool in production, 24x7.
3. How do I use it?
For beginners, try the tools from bcc. See the bcc install instructions for your OS. On Ubuntu, it may be like:
# sudo apt-get update
# sudo apt-get install bpfcc-tools
# sudo /usr/share/bcc/tools/opensnoop
PID    COMM               FD ERR PATH
25548  gnome-shell        33   0 /proc/self/stat
10190  opensnoop          -1   2 /usr/lib/python2.7/encodings/ascii.x86_64-linux-gnu.so
10190  opensnoop          -1   2 /usr/lib/python2.7/encodings/ascii.so
10190  opensnoop          -1   2 /usr/lib/python2.7/encodings/asciimodule.so
10190  opensnoop          18   0 /usr/lib/python2.7/encodings/ascii.py
10190  opensnoop          19   0 /usr/lib/python2.7/encodings/ascii.pyc
25548  gnome-shell        33   0 /proc/self/stat
29588  device poll         4   0 /dev/bus/usb
^C
There I finished by running opensnoop to test that the tools worked. If you get this far, you've used eBPF!
Companies including Netflix and Facebook have bcc installed on all servers by default, and maybe you'll want to as well.
4. Is there a beginner tutorial?
Yes, I created a bcc tutorial, which is a good starting point for beginners to eBPF tracing:
As a beginner, you do not need to write any eBPF code. bcc comes with over 70 tools that you can use straight away. The tutorial steps you through eleven of these: execsnoop, opensnoop, ext4slower (or btrfs*, xfs*, zfs*), biolatency, biosnoop, cachestat, tcpconnect, tcpaccept, tcpretrans, runqlat, and profile.
Once you've tried these, you just need to be aware that many more exist:
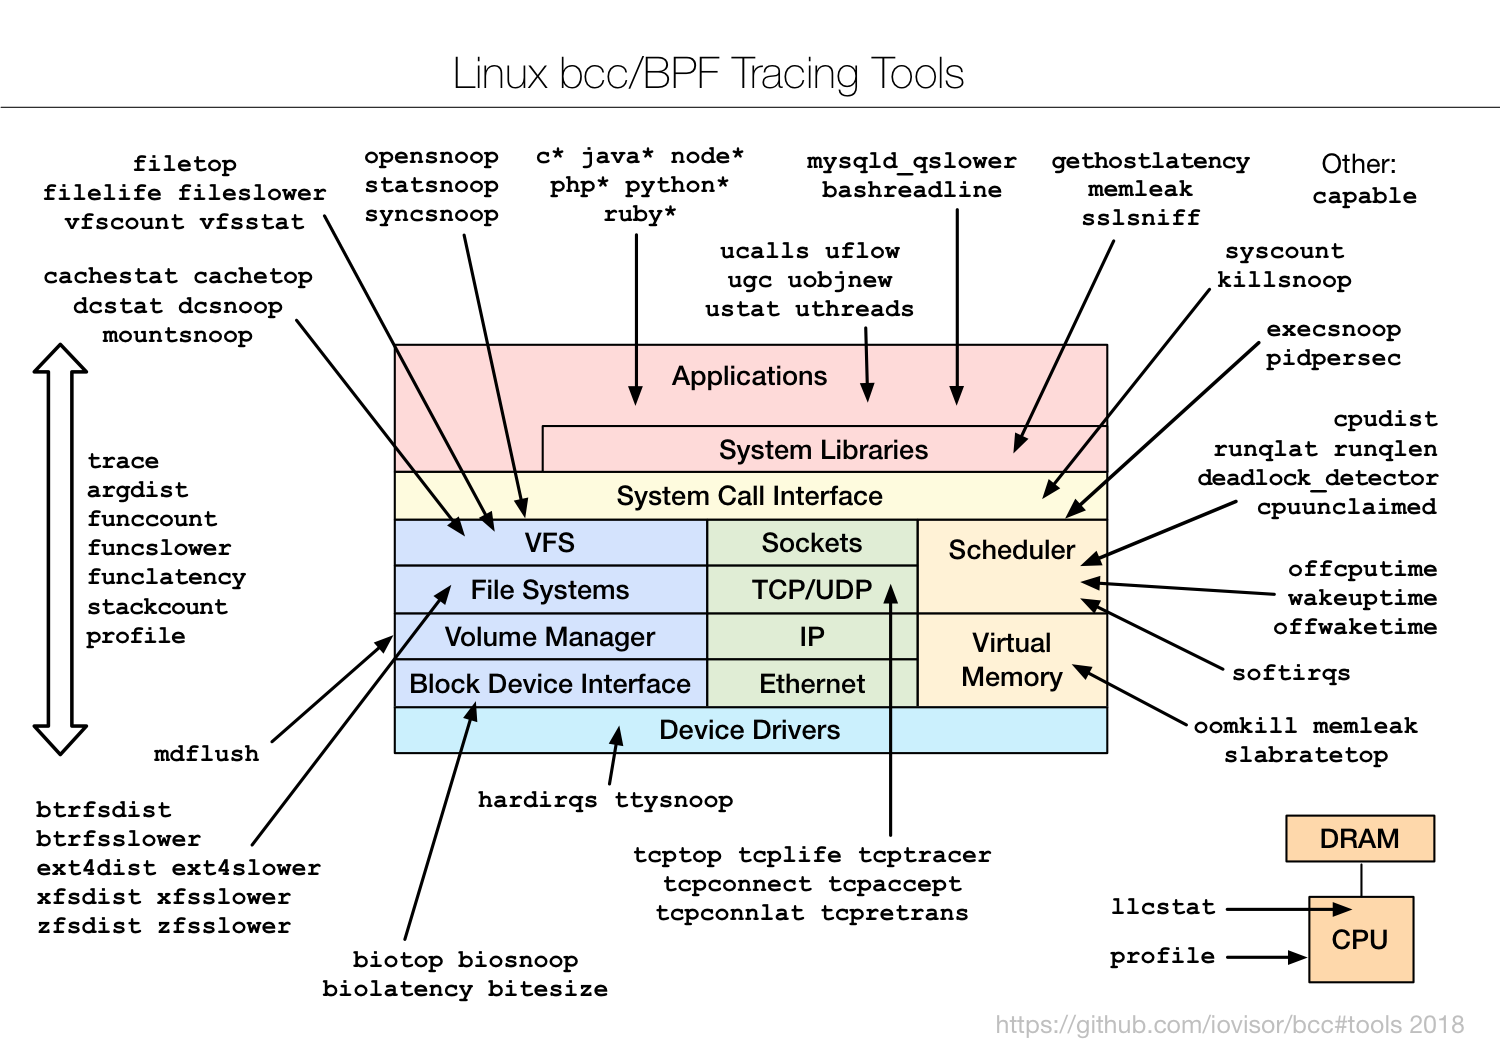
These are also fully documented with man pages and example files. The example files (*_example.txt in bcc/tools) show screenshots with explanations: for example, biolatency_example.txt. I wrote many of these example files (and man pages, and tools), which are like an extra 50 blog posts you'll find in the bcc repo.
What's missing is production examples. I wrote all this documentation when eBPF was so new it was only available on our test instances, so most of the examples are synthetic. Over time we'll add real world examples, and it's an area beginners can help: if you solve an issue with a tool, consider publishing a post to share the screenshots, or adding them to the example files.
Intermediate
At this point you should have bcc running and have tried the tools, and you're interested in customizing them and writing your own tools. The best path is to switch to bpftrace, which has a high-level language that is much easier to learn. The downside is that it's not as customizable as bcc, so you may eventually run into limitations and want to switch back to bcc.
See the bpftrace install instructions. It's a newer project, so it isn't packaged everywhere at the time of writing this post. In the future, it should just be an apt-get install bpftrace or equivalent.
1. bpftrace Tutorial
I developed a tutorial that teaches bpftrace via a series of one-liners:
This provides 12 lessons that will teach you bpftrace bit by bit. An example screenshot:
# bpftrace -e 'tracepoint:syscalls:sys_enter_open { printf("%d %s\n", pid, str(args->filename)); }'
Attaching 1 probe...
181 /proc/cpuinfo
181 /proc/stat
1461 /proc/net/dev
1461 /proc/net/if_inet6
^C
That's using the open syscall tracepoint to trace the PID and path opened.
2. bpftrace Reference Guide
For more on bpftrace, I created the reference guide which has examples for the syntax, probes, and builtins:
It's terse on purpose: as much as possible I fit a topic heading, summary, and screenshot all on one screen. If you look up something and need to hit page down several times, I think it's too long.
3. bpftrace Examples
There are over 20 tools in the bpftrace repository that you can browse as examples:
For example:
# cat tools/biolatency.bt
[...]
BEGIN
{
    printf("Tracing block device I/O... Hit Ctrl-C to end.\n");
}

kprobe:blk_account_io_start
{
    @start[arg0] = nsecs;
}

kprobe:blk_account_io_completion
/@start[arg0]/

{
    @usecs = hist((nsecs - @start[arg0]) / 1000);
    delete(@start[arg0]);
}
Like bcc, these tools have man pages and example files. For example, biolatency_example.txt.
Advanced
1. Learn bcc Development
I've created two documents to help here:
There's also lots of examples under bcc/tools/*.py. bcc tools are of two parts: the BPF code for the kernel, written in C, and the user-space tool written in Python (or lua, or C++). Developing bcc tools is somewhat advanced, and may involve some gritty kernel or application internals.
2. Contribute
Help is appreciated:
For bpftrace, I created a bpftrace Internals Development Guide. It gets hard as you're coding in llvm IR, but if you're up for a challenge...
There's also the kernel eBPF (aka BPF) engine: if you browse bcc and bpftrace issues, you'll see some requests for enhancements there. Eg, the bpftrace kernel tag. Also watch the netdev mailing list for the latest kernel BPF developments, which are added to net-next before they are merged into mainline Linux.
Apart from writing code, you can also contribute with testing, packaging, blog posts, and talks.
Summary
eBPF does many things. In this post I covered how to learn eBPF for tracing and performance analysis. In summary:
- Beginner: run bcc tools
- Intermediate: develop bpftrace tools
- Advanced: develop bcc tools, contribute to bcc & bpftrace
I also have a dedicate page on eBPF Tracing Tools that covers these in more detail. Good luck!
Click here for Disqus comments (ad supported).