

Originally posted at https:/opensource.com/article/19/8/introduction-bpftrace.
bpftrace is a new open source tracer for Linux for analyzing production performance problems and troubleshooting software. It is used by and has had contributions from many companies including Netfilx, Facebook, Red Hat, Shopify, and others. It was created by Alastair Robertson, a talented UK-based developer who has previously won various coding competitions.
Linux already has many performance tools, but these are often counter-based and have limited visibility. For example, iostat(1), or a monitoring agent, may tell you your average disk latency, but not the distribution of this latency. Distributions can reveal multiple modes, or outliers, either of which may be the real cause of your performance problems. bpftrace is suited for this kind of analysis: decomposing metrics into distributions or per-event logs, and creating new metrics for visibility into blind spots.
You can use bpftrace via one-liners or scripts, and it ships with many prewritten tools. Here is an example screenshot: tracing the distribution of read latency for PID 181, and showing it as a power-of-two histogram:
# bpftrace -e 'kprobe:vfs_read /pid == 30153/ { @start[tid] = nsecs; }
kretprobe:vfs_read /@start[tid]/ { @ns = hist(nsecs - @start[tid]); delete(@start[tid]); }'
Attaching 2 probes...
^C

@ns:
[256, 512)         10900 |@@@@@@@@@@@@@@@@@@@@@@@@@@@@@@                      |
[512, 1k)          18291 |@@@@@@@@@@@@@@@@@@@@@@@@@@@@@@@@@@@@@@@@@@@@@@@@@@@@|
[1k, 2k)            4998 |@@@@@@@@@@@@@@                                      |
[2k, 4k)              57 |                                                    |
[4k, 8k)             117 |                                                    |
[8k, 16k)             48 |                                                    |
[16k, 32k)           109 |                                                    |
[32k, 64k)             3 |                                                    |
This example instrumented one of many thousands of available events. If you have some weird performance problem, there's probably some bpftrace one-liner that can shed light on it. For large environments, this ability can help you save millions. For smaller environments, it can be of more use helping eliminate latency outliers.
I previously wrote about bpftrace vs other tracers, including BCC (BPF Compiler Collection). BCC is great for canned complex tools and agents. bpftrace is best for short scripts and ad hoc investigations. In this post I'll summarize the bpftrace language, variable types, probes, and tools.
bpftrace uses BPF (Berkeley Packet Filter), an in-kernel execution engine that processes a virtual instruction set. BPF has been extended (aka eBPF) in recent years for providing a safe way to extend kernel functionality, and has become a hot topic in systems engineering, with at least 24 talks on BPF at the last Linux Plumber's conference. BPF is in the Linux kernel, and bpftrace is the best way to get started using BPF for observability.
See the bpftrace INSTALL guide for how to install it, and get the latest version: 0.9.1 was just released. For Kubernetes clusters, there is also kubectl-trace for running it.
Syntax
probe[,probe,...] /filter/ { action }
The probe specifies what events to instrument, the filter is optional and can filter down the events based on a boolean expression, and the action is the mini program that runs.
Here's hello world:
# bpftrace -e 'BEGIN { printf("Hello eBPF!\n"); }'
The probe is BEGIN, a special probe that runs at the beginning of the program (like awk). There's no filter. The action is a printf() statement.
Now a real example:
# bpftrace -e 'kretprobe:sys_read /pid == 181/ { @bytes = hist(retval); }'
This uses a kretprobe to instrument the return of the sys_read() kernel function. If the PID is 181, a special map variable @bytes is populated with a log2 histogram function with the return value retval of sys_read(). This produces a histogram of the returned read size for PID 181. Is your app doing lots of 1 byte reads? Maybe that can be optimized.
Probe Types
These are libraries of probes which are related. The currently supported types are (more will be added):
| Type | Description |
|---|---|
| tracepoint | Kernel static instrumentation points |
| usdt | User-level statically defined tracing |
| kprobe | Kernel dynamic function instrumentation |
| kretprobe | Kernel dynamic function return instrumentation |
| uprobe | User-level dynamic function instrumentation |
| uretprobe | User-level dynamic function return instrumentation |
| software | Kernel software-based events |
| hardware | Hardware counter-based instrumentation |
| watchpoint | Memory watchpoint events (in development) |
| profile | Timed sampling across all CPUs |
| interval | Timed reporting (from one CPU) |
| BEGIN | Start of bpftrace |
| END | End of bpftrace |
If you're new to this terminology: dynamic instrumentation (aka dynamic tracing) is the superpower that lets you trace any software function in a running binary without restarting it. This lets you get to the bottom of just about any problem. However, the functions it exposes are not considered a stable API, as they can change from one software version to another. Hence static instrumentation, where event points are hard-coded and become a stable API. When you write bpftrace programs, try to use the static types first, before the dynamic ones, so that your programs are more stable.
Variable Types
| Variable | Description |
|---|---|
| @name | global |
| @name[key] | hash |
| @name[tid] | thread-local |
| $name | scratch |
Variables with a '@' prefix use BPF maps, which can behave like associative arrays. They can be populated in one of two ways:
- variable assignment: @name = x;
- function assignment: @name = hist(x);
There are various map-populating functions as builtins that provide quick ways to summarize data.
Builtins Variables and Functions
I'll mention some here to help introduce bpftrace, but there are many more.
Builtin variables include:
| Variable | Description |
|---|---|
| pid | process ID |
| comm | Process or command name |
| nsecs | Current time in nanoseconds |
| kstack | Kernel stack trace |
| ustack | User-level stack trace |
| arg0...argN | Function arguments |
| args | Tracepoint arguments |
| retval | Function return value |
| name | Full probe name |
Builtin functions include:
| Function | Description |
|---|---|
| printf("...") | Print formatted string |
| time("...") | Print formatted time |
| system("...") | Run shell command |
| @ = count() | Count events |
| @ = hist(x) | Power-of-2 histogram for x |
| @ = lhist(x, min, max, step) | Linear histogram for x |
See the reference guide for everything.
One-Liners Tutorial
A great way to learn bpftrace is via one-liners, which I turned into the one-liners tutorial. That tutorial covers the following one-liners:
1. Listing probes
bpftrace -l 'tracepoint:syscalls:sys_enter_*'

2. Hello world
bpftrace -e 'BEGIN { printf("hello world\n") }'

3. File opens
bpftrace -e 'tracepoint:syscalls:sys_enter_open { printf("%s %s\n", comm, str(args->filename)) }'

4. Syscall counts by process
bpftrace -e 'tracepoint:raw_syscalls:sys_enter { @[comm] = count() }'

5. Distribution of read() bytes
bpftrace -e 'tracepoint:syscalls:sys_exit_read /pid == 18644/ { @bytes = hist(args->retval) }'

6. Kernel dynamic tracing of read() bytes
bpftrace -e 'kretprobe:vfs_read { @bytes = lhist(retval, 0, 2000, 200) }'

7. Timing read()s
bpftrace -e 'kprobe:vfs_read { @start[tid] = nsecs }
    kretprobe:vfs_read /@start[tid]/ { @ns[comm] = hist(nsecs - @start[tid]); delete(@start[tid]) }'

8. Count process-level events
bpftrace -e 'tracepoint:sched:sched* { @[name] = count() } interval:s:5 { exit() }'

9. Profile on-CPU kernel stacks
bpftrace -e 'profile:hz:99 { @[stack] = count() }'

10. Scheduler tracing
bpftrace -e 'tracepoint:sched:sched_switch { @[stack] = count() }'

11. Block I/O tracing
bpftrace -e 'tracepoint:block:block_rq_complete { @ = hist(args->nr_sector * 512) }'
See the tutorial for an explanation of each of these.
Provided Tools
Apart from one-liners, bpftrace programs can be multi-line scripts. bpftrace ships with 28 of these as tools:
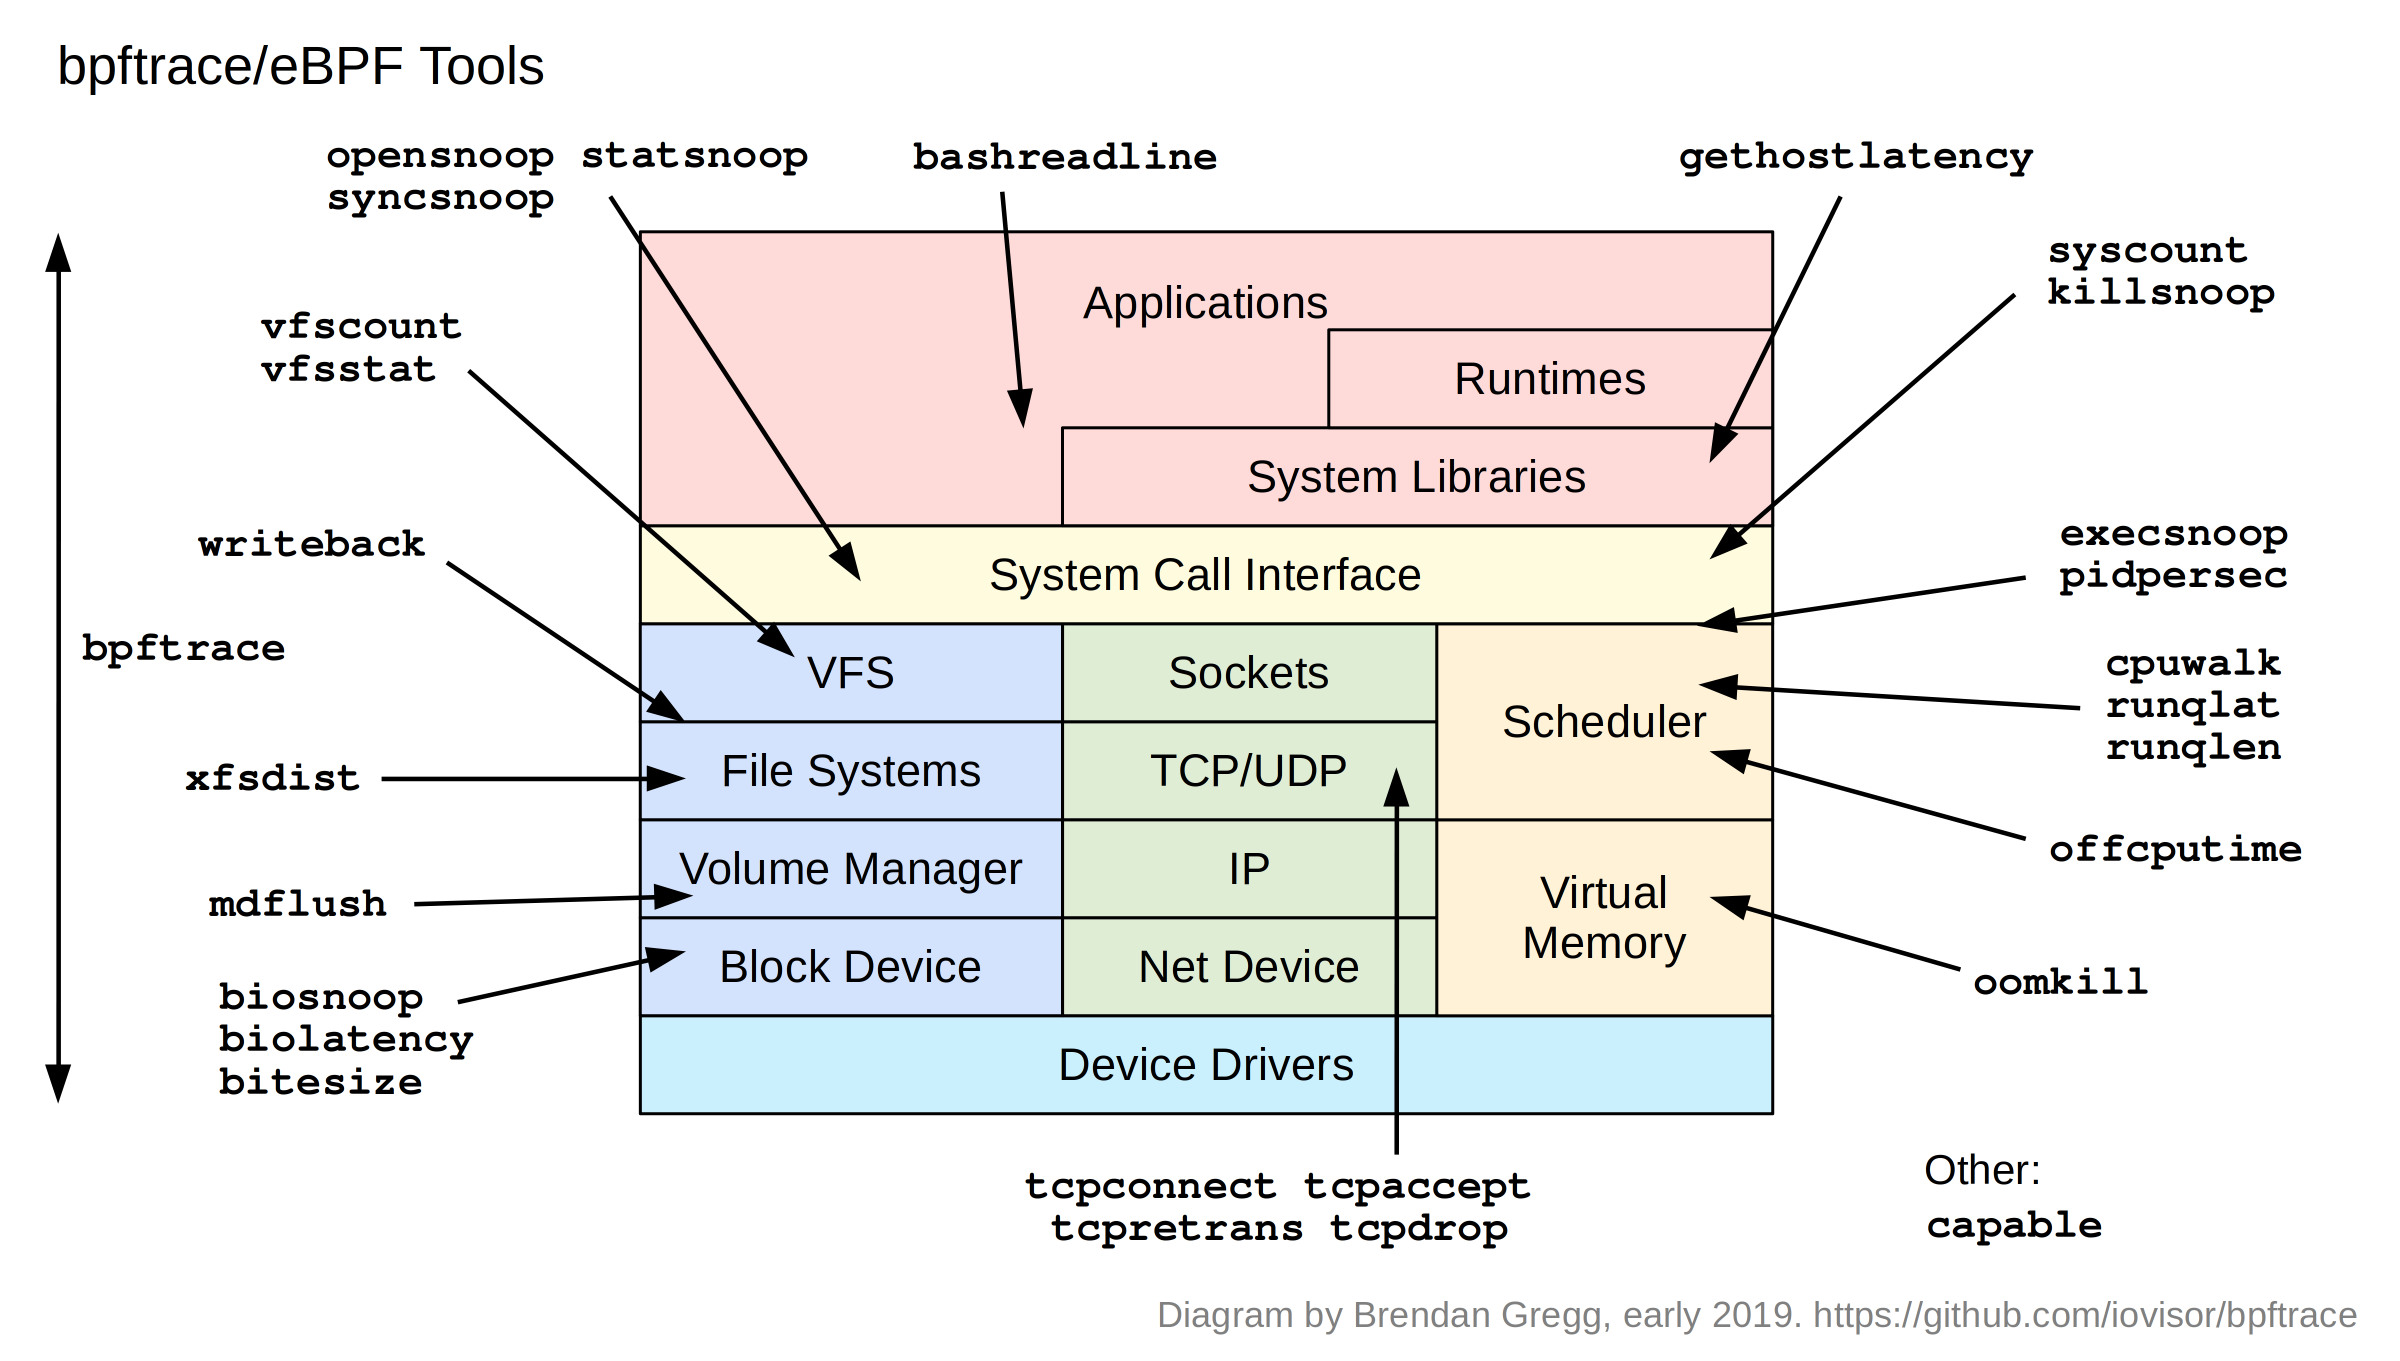
These tools can be found in the /tools directory:
tools# ls *.bt
bashreadline.bt  dcsnoop.bt         oomkill.bt    syncsnoop.bt   vfscount.bt
biolatency.bt    execsnoop.bt       opensnoop.bt  syscount.bt    vfsstat.bt
biosnoop.bt      gethostlatency.bt  pidpersec.bt  tcpaccept.bt   writeback.bt
bitesize.bt      killsnoop.bt       runqlat.bt    tcpconnect.bt  xfsdist.bt
capable.bt       loads.bt           runqlen.bt    tcpdrop.bt
cpuwalk.bt       mdflush.bt         statsnoop.bt  tcpretrans.bt
Apart from their use with diagnosing performance issues and general troubleshooting, they also provide another way to learn bpftrace: by example.
Source
Here's the code to biolatency.bt:
tools# cat -n biolatency.bt
     1  /*
     2   * biolatency.bt    Block I/O latency as a histogram.
     3   *                  For Linux, uses bpftrace, eBPF.
     4   *
     5   * This is a bpftrace version of the bcc tool of the same name.
     6   *
     7   * Copyright 2018 Netflix, Inc.
     8   * Licensed under the Apache License, Version 2.0 (the "License")
     9   *
    10   * 13-Sep-2018  Brendan Gregg   Created this.
    11   */
    12
    13  BEGIN
    14  {
    15      printf("Tracing block device I/O... Hit Ctrl-C to end.\n");
    16  }
    17
    18  kprobe:blk_account_io_start
    19  {
    20      @start[arg0] = nsecs;
    21  }
    22
    23  kprobe:blk_account_io_done
    24  /@start[arg0]/
    25
    26  {
    27      @usecs = hist((nsecs - @start[arg0]) / 1000);
    28      delete(@start[arg0]);
    29  }
    30
    31  END
    32  {
    33      clear(@start);
    34  }
It's straightforward and easy to read, and short enough to include on a slide. This version is using kernel dynamic tracing to instrument the blk_account_io_start() and blk_account_io_done() functions, and passes a timestamp between them keyed on arg0 to each. arg0 on kprobe is the first argument to that function, which for these is the struct request *, and its memory address is used as a unique identifier.
Examples
Screenshots from these tools is also provided in *_example.txt files, where I explain exactly what we are seeing. For example:
tools# more biolatency_example.txt
Demonstrations of biolatency, the Linux BPF/bpftrace version.


This traces block I/O, and shows latency as a power-of-2 histogram. For example:

# biolatency.bt
Attaching 3 probes...
Tracing block device I/O... Hit Ctrl-C to end.
^C

@usecs:
[256, 512)             2 |                                                    |
[512, 1K)             10 |@                                                   |
[1K, 2K)             426 |@@@@@@@@@@@@@@@@@@@@@@@@@@@@@@@@@@@@@@@@@@@@@@@@@@@@|
[2K, 4K)             230 |@@@@@@@@@@@@@@@@@@@@@@@@@@@@                        |
[4K, 8K)               9 |@                                                   |
[8K, 16K)            128 |@@@@@@@@@@@@@@@                                     |
[16K, 32K)            68 |@@@@@@@@                                            |
[32K, 64K)             0 |                                                    |
[64K, 128K)            0 |                                                    |
[128K, 256K)          10 |@                                                   |

While tracing, this shows that 426 block I/O had a latency of between 1K and 2K
usecs (1024 and 2048 microseconds), which is between 1 and 2 milliseconds.
There are also two modes visible, one between 1 and 2 milliseconds, and another
between 8 and 16 milliseconds: this sounds like cache hits and cache misses.
There were also 10 I/O with latency 128 to 256 ms: outliers. Other tools and
instrumentation, like biosnoop.bt, can shed more light on those outliers.
[...]
Sometimes it can be most effective to switch straight to the example file when trying to understand these tools, since the output may be self evident (by design!).
Man pages
There are also man pages for every tool, under /man/man8. They include sections on the output fields, and expected overhead of the tool.
# nroff -man man/man8/biolatency.8
biolatency(8)               System Manager's Manual              biolatency(8)


NAME
       biolatency.bt - Block I/O latency as a histogram. Uses bpftrace/eBPF.

SYNOPSIS
       biolatency.bt

DESCRIPTION
       This  tool  summarizes  time  (latency) spent in block device I/O (disk
       I/O) as a power-of-2 histogram. This  allows  the  distribution  to  be
       studied,  including  modes and outliers. There are often two modes, one
       for device cache hits and one for cache misses, which can be  shown  by
       this tool. Latency outliers will also be shown.
[...]
Writing all these man pages was the least fun part of developing these tools, and in some cases tool longer to write than the tool took to develop, but it's nice to see the final result.
bpftrace vs BCC
Since eBPF has been merging in the kernel, most effort has been on the BCC front-end, which provides a BPF library and Python, C++, and lua interfaces for writing programs. I've developed a lot of tools in BCC/python, and it works great, although coding in BCC is verbose. If you're hacking away at a performance issue, bpftrace is better for all the one-off custom queries you have. If you're writing a tool with many command line options, or an agent that uses Python libraries, you'll want to consider using BCC.
Here's how these will be used at Netflix: on the performance team, I use both: BCC for developing canned tools that others can easily use, and for developing agents; and bpftrace for ad hoc analysis. On, say, the network engineering team, they have been using BCC to develop an agent for their needs. The security team are most interested in bpftrace for quick ad hoc instrumentation for detecting zero day vulnerabilities. And for the developer teams: I expect they'll use both without knowing it via the self-service GUIs we are building (Vector), and occasionally may ssh onto an instance and run a canned tool or ad hoc bpftrace one-liner.
More bpftrace reading
- The bpftrace repository on github
- The bpftrace one-liners tutorial
- The bpftrace reference guide
- The BCC repository for more complex BPF-based tools
I also have a book coming out this year that covers bpftrace: BPF Performance Tools: Linux System and Application Observability, to be published by Addison Wesley, and which contains many new bpftrace tools.
Thanks to Alastair Robertson for creating bpftrace, and the bpftrace, BCC, and BPF communities for all the work over the past five years.
Click here for Disqus comments (ad supported).