

People often tell me they don't understand performance tool output because they can't tell what's "good" or "bad." It can be hard as performance is subjective. What's good for one user may be bad for another. There are also cases where I can't tell either: The tools only provide clues for further analysis.
I recently encountered terrible disk performance and thought it'd be useful to collect Linux tool screenshots and share them for reference. E.g., iostat(1):
$ iostat -xz 10
[...]
Device      r/s     w/s     rkB/s     wkB/s   rrqm/s   wrqm/s  %rrqm  %wrqm r_await w_await aqu-sz rareq-sz wareq-sz  svctm  %util
nvme0n1    4.40    6.00     42.00     43.20     0.00     4.30   0.00  41.75    6.45    0.80   0.03     9.55     7.20   0.15   0.16
dm-0       4.40   10.30     42.00     43.20     0.00     0.00   0.00   0.00    6.55    0.47   0.03     9.55     4.19   0.54   0.80
dm-1       4.40    9.80     42.00     43.20     0.00     0.00   0.00   0.00    6.55    0.49   0.03     9.55     4.41   0.56   0.80
sdb        4.50    0.00    576.00      0.00     0.00     0.00   0.00   0.00  434.31    0.00   1.98   128.00     0.00 222.22 100.00
It's the sdb disk and I'm first looking at the r_await column to see the average time in milliseconds for reads. An average of 434 ms is awful, and a small queue size (aqu-sz) indicates it's a problem with the disk and not the workload applied. I want to see distributions and event logs. But first, about this disk...
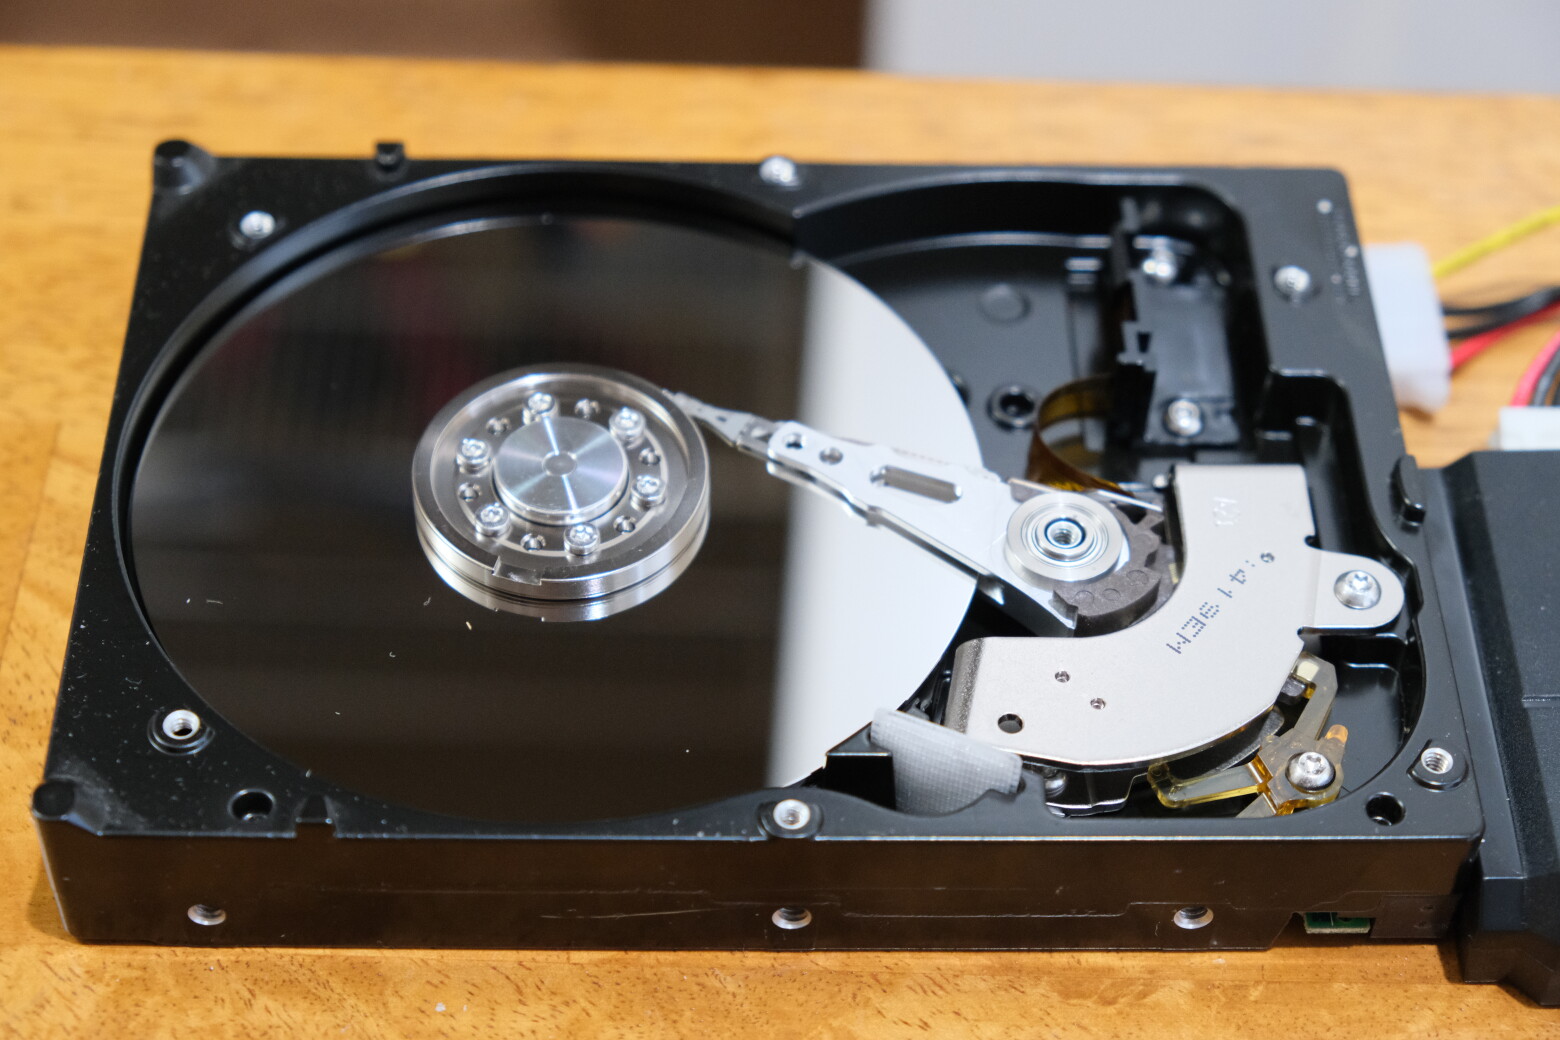
See the dust on this disk?
Flying height
Were you ever taught in computer science that the size of a dust particle dwarfs the distance between the disk head and the platter? Something like:
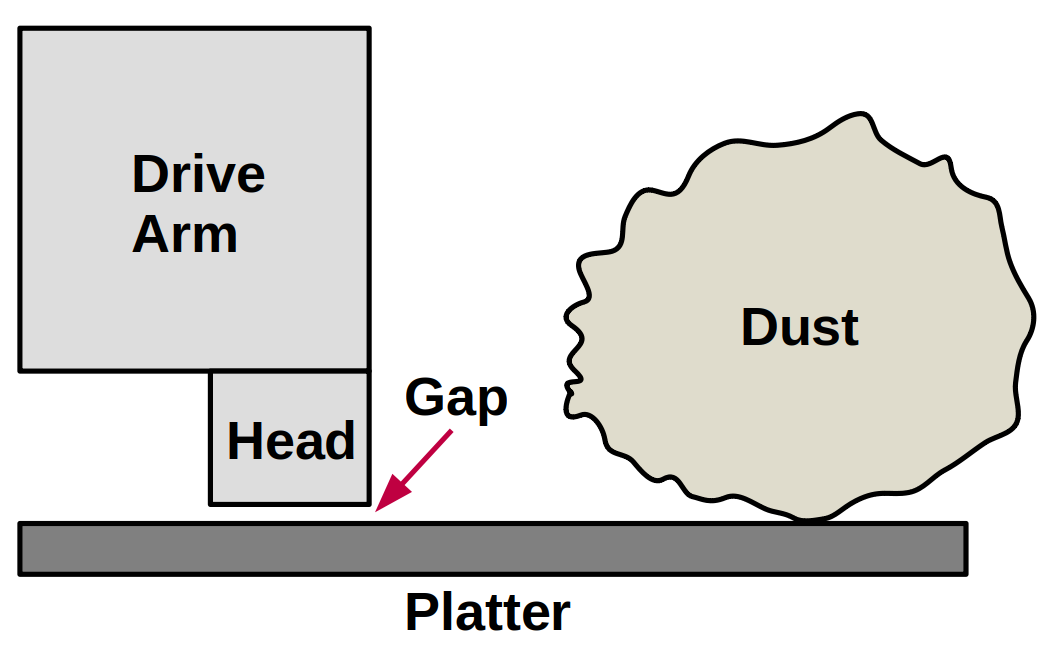
It's called "flying height" or "fly height," and (from that reference) was about 5 nanometers for 2011 drives. Particles of dust can be 1000x bigger. The heads "float" on a film of air, and this is sometimes described as "air lubrication." To quote from an article about hard drive air filters: "some hard drives are not rated to exceed 7,000 feet while operating because the air pressure would be too low inside the drive to float the heads properly." Such hard drives have air ports, and air filters, to equalize pressure with the outside air. (Update: Some modern drives after 2015 are sealed with helium.)
I was first told about the ratio between fly height and particles of dust in a computer studies class at school, with the teacher drawing this diagram on a chalkboard. I assumed that a speck of dust would destroy a drive head at 7200 rpm. Right?
I just found a Quora article with a better diagram than mine, which also asks the question So, what do YOU think would happen if the disk read/write head were to run over a speck of dust? (The article doesn't answer.)
What happened
The disk photo is an 80 Gbyte Western Digital IDE disk I found when packing up to move house. Missing its lid. Dusty. I'd also recently bought a SATA/IDE to USB hub and couldn't resist seeing if the disk was readable despite the dust, and finding out what was on it (I'd forgotten). Surely it's unreadable, right?...
The drive failed immediately. The disk sped up, the head clicked, then sped down with an error. I found the lid but no drive screws, and rested it on top. Still errored. By pushing down on the lid, however, (simulating screws) it sped up and down a few times before failing. The harder I pushed the less it vibrated and the more it worked, until I finally had it returning I/O, albeit slowly. (This may be the opposite of my famous shouting video: This time I'm suppressing vibration to make a disk work.)
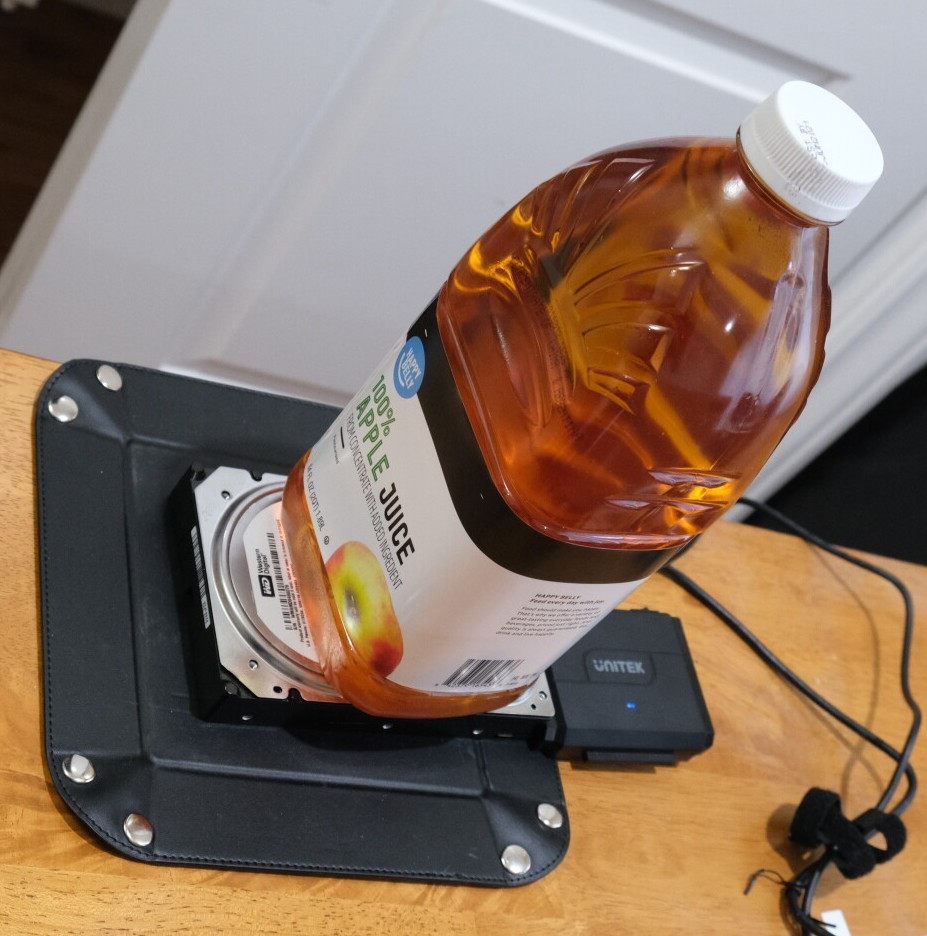
I managed to read over 99.9999% of disk sectors successfully. It took several hours so I left a bottle of apple juice pressing the lid down. Performance was still poor, but the head wasn't obliterated. Only an 8-Kbyte sequential chunk failed and could not be read (big bit of dust?). The iostat output from earlier (and the screenshots below) are the performance of this disk, dust-n-all.
While dust may have been a factor, I think the biggest cause for poor performance was vibration with the lid unscrewed, based on how much faster it worked when I used my body weight to hold the lid down. I could hear it spin faster. It seemed to have several set speeds, and when pushing hard it would try a faster speed for a couple of seconds, then a faster one, until it found the fastest it could operate (presumably it tries faster speeds until it begins to get sector-ECC errors). The way it tried faster speeds somehow reminded me of how 32x CDROM drives operated.
Screenshots
Back to my opening line: The following screenshots may help you better understand these tool outputs. I'll start with the worst performance and then show moderately-poor performance. From these outputs I try to determine if the problem is:
- The workload: High-latency disk I/O is commonly caused by the workload applied. It may be due to queueing, especially from file systems that send a batch of writes. It can also be simply large I/O, or the presence of other disk commands that slow subsequent I/O.
- The disk: If it isn't the workload applied, then slow I/O may well be caused by a bad disk.
Analysis is similar whether the disk is rotational magnetic or flash-memory based. Rotational disks have extra latency from head seeks for random I/O, and spin ups from the idle state.
The workload is 128 Kbyte sequential reads using the dd(1) utility. I'd guess they'd normally take between 1 and 2 ms for this disk.
Worst performance
iostat(1), printing 10-second summaries:
$ iostat -xz 10
Linux 4.15.0-66-generic (lgud-bgregg)   12/16/2020  _x86_64_    (8 CPU)

avg-cpu:  %user   %nice %system %iowait  %steal   %idle
           7.70    0.01    2.03    0.09    0.00   90.17
[...]

avg-cpu:  %user   %nice %system %iowait  %steal   %idle
           7.90    0.00    2.07   10.87    0.00   79.15

Device      r/s     w/s     rkB/s     wkB/s   rrqm/s   wrqm/s  %rrqm  %wrqm r_await w_await aqu-sz rareq-sz wareq-sz  svctm  %util
nvme0n1    0.40   15.30      2.00    167.20     0.00     2.70   0.00  15.00    7.00    0.81   0.01     5.00    10.93   0.13   0.20
dm-0       0.40   18.00      2.00    167.20     0.00     0.00   0.00   0.00    7.00    7.69   0.14     5.00     9.29   0.33   0.60
dm-1       0.30   17.80      1.60    167.20     0.00     0.00   0.00   0.00    6.67    7.78   0.14     5.33     9.39   0.29   0.52
dm-2       0.10    0.00      0.40      0.00     0.00     0.00   0.00   0.00    8.00    0.00   0.00     4.00     0.00   8.00   0.08
sdb        7.30    0.00    934.40      0.00     0.00     0.00   0.00   0.00  269.70    0.00   1.97   128.00     0.00 136.88  99.92

avg-cpu:  %user   %nice %system %iowait  %steal   %idle
           7.70    0.00    1.66   10.97    0.00   79.68

Device      r/s     w/s     rkB/s     wkB/s   rrqm/s   wrqm/s  %rrqm  %wrqm r_await w_await aqu-sz rareq-sz wareq-sz  svctm  %util
nvme0n1    4.40    6.00     42.00     43.20     0.00     4.30   0.00  41.75    6.45    0.80   0.03     9.55     7.20   0.15   0.16
dm-0       4.40   10.30     42.00     43.20     0.00     0.00   0.00   0.00    6.55    0.47   0.03     9.55     4.19   0.54   0.80
dm-1       4.40    9.80     42.00     43.20     0.00     0.00   0.00   0.00    6.55    0.49   0.03     9.55     4.41   0.56   0.80
sdb        4.50    0.00    576.00      0.00     0.00     0.00   0.00   0.00  434.31    0.00   1.98   128.00     0.00 222.22 100.00

avg-cpu:  %user   %nice %system %iowait  %steal   %idle
           6.89    0.00    1.90   10.99    0.00   80.23

Device      r/s     w/s     rkB/s     wkB/s   rrqm/s   wrqm/s  %rrqm  %wrqm r_await w_await aqu-sz rareq-sz wareq-sz  svctm  %util
nvme0n1    0.30    7.60      1.20    119.20     0.00     4.40   0.00  36.67    2.67    1.63   0.01     4.00    15.68   0.20   0.16
dm-0       0.30   12.00      1.20    119.20     0.00     0.00   0.00   0.00    2.67    2.30   0.03     4.00     9.93   0.55   0.68
dm-1       0.30   11.40      1.20    119.20     0.00     0.00   0.00   0.00    2.67    2.42   0.03     4.00    10.46   0.58   0.68
sdb        3.50    0.00    448.00      0.00     0.00     0.00   0.00   0.00  579.66    0.00   1.99   128.00     0.00 285.71 100.00
This output shows 10-second statistical summaries. Massive r_await with little aqu-sz, as mentioned earlier. The read size is large (128 Kbyte average as seen in iostat(1)), but that's not excessive.
biolatency (this is my BPF tool from bcc), printing 60-second histograms, per disk (-D):
# biolatency -D 60 1
Tracing block device I/O... Hit Ctrl-C to end.


disk = 'nvme0n1'
     usecs               : count     distribution
         0 -> 1          : 0        |                                        |
         2 -> 3          : 0        |                                        |
         4 -> 7          : 0        |                                        |
         8 -> 15         : 12       |*                                       |
        16 -> 31         : 318      |****************************************|
        32 -> 63         : 210      |**************************              |
        64 -> 127        : 106      |*************                           |
       128 -> 255        : 65       |********                                |
       256 -> 511        : 29       |***                                     |
       512 -> 1023       : 31       |***                                     |
      1024 -> 2047       : 81       |**********                              |
      2048 -> 4095       : 93       |***********                             |
      4096 -> 8191       : 76       |*********                               |

disk = 'sdb'
     usecs               : count     distribution
         0 -> 1          : 0        |                                        |
         2 -> 3          : 0        |                                        |
         4 -> 7          : 0        |                                        |
         8 -> 15         : 0        |                                        |
        16 -> 31         : 0        |                                        |
        32 -> 63         : 0        |                                        |
        64 -> 127        : 0        |                                        |
       128 -> 255        : 0        |                                        |
       256 -> 511        : 0        |                                        |
       512 -> 1023       : 0        |                                        |
      1024 -> 2047       : 0        |                                        |
      2048 -> 4095       : 0        |                                        |
      4096 -> 8191       : 0        |                                        |
      8192 -> 16383      : 0        |                                        |
     16384 -> 32767      : 1        |                                        |
     32768 -> 65535      : 15       |**                                      |
     65536 -> 131071     : 214      |****************************************|
    131072 -> 262143     : 84       |***************                         |
    262144 -> 524287     : 46       |********                                |
    524288 -> 1048575    : 7        |*                                       |
   1048576 -> 2097151    : 0        |                                        |
   2097152 -> 4194303    : 1        |                                        |
Note the sdb latencies range from 32 ms to over 2 seconds!
biosnoop (this is my BPF tool from bcc), printing every disk event:
# biosnoop
TIME(s)     COMM           PID    DISK    T SECTOR     BYTES  LAT(ms)
0.000000    dd             16014  sdb     R 37144544   131072   77.96
0.008933    biosnoop       21118  nvme0n1 R 652936664  4096      7.53
0.143268    dd             16014  sdb     R 37144800   131072  143.20
0.333243    dmcrypt_write  347    nvme0n1 W 244150736  4096      2.72
0.333256    dmcrypt_write  347    nvme0n1 W 244150744  4096      2.49
0.333259    dmcrypt_write  347    nvme0n1 W 244150752  4096      1.38
0.361565    dd             16014  sdb     R 37145056   131072  218.24
0.463294    dd             16014  sdb     R 37145312   131072  101.70
0.590237    dd             16014  sdb     R 37145568   131072  126.92
0.734682    dd             16014  sdb     R 37145824   131072  144.38
0.864665    Cache2 I/O     6515   nvme0n1 R 694714632  4096      0.10
0.961290    dd             16014  sdb     R 37146080   131072  226.55
1.063137    dd             16014  sdb     R 37146336   131072  101.79
1.198111    dd             16014  sdb     R 37146592   131072  134.91
1.425886    dd             16014  sdb     R 37146848   131072  227.74
1.619342    dd             16014  sdb     R 37147104   131072  193.38
1.754445    dd             16014  sdb     R 37147360   131072  135.04
1.856156    dd             16014  sdb     R 37147616   131072  101.65
2.000656    dd             16014  sdb     R 37147872   131072  144.42
2.102591    dd             16014  sdb     R 37148128   131072  101.83
2.204427    dd             16014  sdb     R 37148384   131072  101.77
2.397540    dd             16014  sdb     R 37148640   131072  193.05
2.567098    dd             16014  sdb     R 37148896   131072  169.52
2.576776    dmcrypt_write  347    nvme0n1 W 94567816   57344     7.46
2.577205    dmcrypt_write  347    nvme0n1 W 499469088  12288     0.02
2.577272    dmcrypt_write  347    nvme0n1 W 499469112  16384     0.04
2.580759    dmcrypt_write  347    nvme0n1 W 499469144  4096      2.03
2.752098    dd             16014  sdb     R 37149152   131072  184.94
2.945566    dd             16014  sdb     R 37149408   131072  193.41
3.039011    dd             16014  sdb     R 37149664   131072   93.38
3.165834    dd             16014  sdb     R 37149920   131072  126.76
3.401771    dd             16014  sdb     R 37150176   131072  235.87
3.536805    dd             16014  sdb     R 37150432   131072  134.95
3.705294    dd             16014  sdb     R 37150688   131072  168.43
3.772291    Cache2 I/O     6515   nvme0n1 R 694703744  4096      7.55
3.873563    dd             16014  sdb     R 37150944   131072  168.21
4.018151    dd             16014  sdb     R 37151200   131072  144.53
4.253137    dd             16014  sdb     R 37151456   131072  234.92
4.310591    dmcrypt_write  347    nvme0n1 W 220635024  16384     2.70
[...]
This shows individual I/O to disk sdb taking 100 ms and more (LAT(ms)). If I ran this for long enough I should see outliers reaching up to over 2 seconds.
I don't see evidence of queueing in this biosnoop output: One tell-tale sign of queueing is when I/O latencies ramp up (e.g.: 10ms, 20ms, 30ms, 40ms, etc.) with a steady completion time between them (seen in the TIME(s) column). This can be when the disk is working through its queue, so later I/O have steadily increasing latency. But the completion times and latencies in this output show that the disk doesn't appear to have a deep queue. It's just plain slow.
Poor performance
By pressing hard on the disk lid it was able to operate faster, but still somewhat poor.
# biosnoop
TIME(s)     COMM           PID    DISK    T SECTOR     BYTES  LAT(ms)
[...]
2.643276    dd             16014  sdb     R 46133728   131072    1.60
2.660996    dd             16014  sdb     R 46133984   131072   16.98
2.671327    dd             16014  sdb     R 46134240   131072   10.31
2.673299    dd             16014  sdb     R 46134496   131072    1.94
2.675298    dd             16014  sdb     R 46134752   131072    1.97
2.685624    dd             16014  sdb     R 46135008   131072   10.29
2.705410    dd             16014  sdb     R 46135264   131072   19.76
2.707425    dd             16014  sdb     R 46135520   131072    1.96
2.710357    dd             16014  sdb     R 46135776   131072    1.66
2.716280    dd             16014  sdb     R 46136032   131072    1.62
2.739534    dd             16014  sdb     R 46136288   131072   19.07
2.741464    dd             16014  sdb     R 46136544   131072    1.90
2.743432    dd             16014  sdb     R 46136800   131072    1.93
2.745563    dd             16014  sdb     R 46137056   131072    1.57
2.756934    dd             16014  sdb     R 46137312   131072   10.11
2.783863    dd             16014  sdb     R 46137568   131072   26.90
2.785830    dd             16014  sdb     R 46137824   131072    1.93
2.787835    dd             16014  sdb     R 46138080   131072    1.97
2.790935    dd             16014  sdb     R 46138336   131072    2.55
[...]
The latencies here look like they are a mix of normal speed (~1.9 ms) and slower ones (~10ms and slower). Given it's a 7,200 rpm disk, a revolution takes ~8ms, so if it needs to retry sectors I'd expect to see latencies of 2ms, 10ms, 18ms, 26ms, etc.
Here's the biolatency(1) histograms when the disk is running faster:
disk = 'sdb'
     usecs               : count     distribution
         0 -> 1          : 0        |                                        |
         2 -> 3          : 0        |                                        |
         4 -> 7          : 0        |                                        |
         8 -> 15         : 0        |                                        |
        16 -> 31         : 0        |                                        |
        32 -> 63         : 0        |                                        |
        64 -> 127        : 0        |                                        |
       128 -> 255        : 0        |                                        |
       256 -> 511        : 0        |                                        |
       512 -> 1023       : 0        |                                        |
      1024 -> 2047       : 13       |******                                  |
      2048 -> 4095       : 82       |****************************************|
      4096 -> 8191       : 0        |                                        |
      8192 -> 16383      : 9        |****                                    |
     16384 -> 32767      : 7        |***                                     |
     32768 -> 65535      : 41       |********************                    |
     65536 -> 131071     : 77       |*************************************   |
    131072 -> 262143     : 2        |                                        |
    262144 -> 524287     : 1        |                                        |
The distribution is bimodal. The faster mode will be the sequential reads, the slower mode shows the retries.
And the iostat(1) output when the disk is in this faster state:
$ iostat -xz 10
[...]
avg-cpu:  %user   %nice %system %iowait  %steal   %idle
          11.78    0.00    2.68    2.82    0.00   82.72

Device      r/s     w/s     rkB/s     wkB/s   rrqm/s   wrqm/s  %rrqm  %wrqm r_await w_await aqu-sz rareq-sz wareq-sz  svctm  %util
nvme0n1    3.50   11.70     15.60    146.40     0.40     2.30  10.26  16.43    2.40    0.21   0.00     4.46    12.51   0.05   0.08
dm-0       3.90   14.00     15.60    146.40     0.00     0.00   0.00   0.00    2.87    0.17   0.01     4.00    10.46   0.54   0.96
dm-1       1.40   13.70      5.60    146.40     0.00     0.00   0.00   0.00    4.29    0.18   0.01     4.00    10.69   0.29   0.44
dm-2       2.50    0.00     10.00      0.00     0.00     0.00   0.00   0.00    2.08    0.00   0.01     4.00     0.00   2.08   0.52
sdb      321.40    0.00  41139.20      0.00     0.00     0.00   0.00   0.00    5.11    0.00   1.64   128.00     0.00   3.01  96.88
The average (r_await) of 5.11 ms really doesn't tell the full story like the histogram or per-event output does.
More questions
What's happening to all that dust? Is it stuck to the platter surface, or does it bounce around when the disk is spinning? The photo I included was after I read the entire disk, so the dust didn't end up in the internal air filters. It was still on the platter.
Would a 1 TB disk be as tolerant to dust as this old 80 GB disk? (When I was a sysadmin, I heard a story of how old VAX drives would stall, so holes had been drilled in them with tape over the holes. When stalled, the sysadmin would peel back the tape and use their finger to spin-start them. Those even older drives must have been more tolerant of dust!)
And at what point is there too much dust? I don't recommend you try this, but if I had time or interest I'd create a perspex lid and see how much dust a drive can keep working with.
At least I answered one question. I found that these hard drive heads were not destroyed by dust, and could read almost everything from a dusty disk, albeit slowly. Perhaps that's not the case with more modern SMR disks with smaller tolerances, but I'd have to try, given the surprising result this time.
Click here for Disqus comments (ad supported).