

This is the story of the most unbelievable demo I've been given in world of open source. You can't make this stuff up.
It was 2005, and I felt like I was in the eye of a hurricane. I was an independent performance consultant and Sun Microsystems had just released DTrace, a tool that could instrument all software. This gave performance analysts like myself X-ray vision. While I was busy writing and publishing advanced performance tools using DTrace (my open source DTraceToolkit and other DTrace tools, aka scripts), I noticed something odd: I was producing more DTrace tools than were coming out of Sun itself. Perhaps there was some internal project that was consuming all their DTrace expertise?
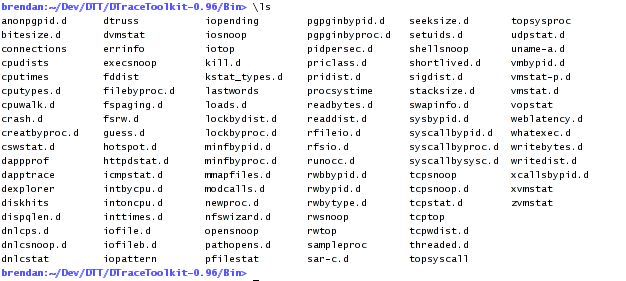
DTraceToolkit v0.96 tools (2006)
As I wasn't a Sun Microsystems employee I wasn't privy to Sun's internal projects. However, I was doing training and consulting for Sun, helping their customers with system administration and performance. Sun sometimes invited me to their own customer meetings and other events I might be interested in, as a local expert. I was living in Sydney, Australia.
This time I was told that there was a Very Important Person visiting from the US whom I'd want to meet. I didn't recognize the name, but was told that he was a DTrace expert and developer at Sun, and was on a world tour demonstrating Sun's new DTrace-based product. Ah-hah – this must be the internal project!
But this would be no ordinary project. I'd seen some amazing technologies from Sun, but I'd never seen a developer on a world tour. This was going to be big, and would likely blow away my earlier DTrace work.
The VIP was returning to Sydney for a few days before going to the next Australian city, so we agreed to meet at the Sun Sydney office.
The Meeting
The DTrace expert arrived wearing casual business attire and a heavy American accent, and seemed a bit weary from his world tour. He had just been to South Africa and New Zealand, and listed other countries and cities he was heading to next. Two other Australian Sun staff joined the meeting, and one introduced me with:
"Brendan teaches some classes for us, and has been doing some DTrace stuff.”
Low-key introductions are the norm in Australia (especially for Australians) and I wondered whether he knew of this cultural difference. Another difference was that there were few roles in Australia for engineers in 2005, unlike the US. The Sun Microsystems Australia jobs, for example, were all in support and none in development, and other tech giants had not yet arrived. So back then in Australia you could find amazing engineers doing whatever roles were available.
I tried to expand on the "stuff" a bit by saying that I’d written the DTraceToolkit, but he wasn't impressed. He didn't recognize my name, nor had he heard of the DTraceToolkit. To him, I was just some random guy.
He was kind enough to give me a quick demo anyway. His DTrace product was an add-on for a larger Sun GUI that I was already familiar with. After it loaded, he showed how you could run one of several DTrace tools by double clicking an icon. Either the raw output would be printed in a separate window, or the results would be shown as a line graph. This seemed quite underwhelming. The GUI already had this functionality: Showing the raw output of tools or drawing a line graph. I was hoping for a new GUI feature.
The only new work was the tools themselves, of which there were several. He gave a quick sales pitch about the new and amazing observability they provided, something he must have said many times to impress customers. I got the feeling he wasn't expecting me to properly appreciate their value.
But I did understand these tools, since I had coded similar functionality for my own DTraceToolkit. They were useful, but...I was expecting a hurricane of awesome new DTrace content.
"I've done these before – I've written tools that do these things myself!"
"Yeah, sure." He didn’t quite say it, but gave me a look like he didn't really believe me, or that I could even truly understand what they were. This was an important innovation by Sun Microsystems, a US-based multinational company worth billions. I was just some random Aussie.
Socket Tracing
I browsed the GUI icons for something new, and the closest was a tool for tracing socket I/O. I had tried this in 2004 (socketsnoop.d) and published it as open source, but my tool was incomplete: I didn't have access to the kernel source code so I had to figure out everything the hard way using black box analysis. It worked for most TCP traffic types but not others, which I warned about in the script comments. I'd also not included it in the DTraceToolkit yet as I didn't consider it finished. So of all the tools he had, I was most interested to see this one. Sun could do a much better job just by referring to the source code they were instrumenting, and actually finish this tool.
"Can I see the socket I/O script?". I fired up a terminal. He looked alarmed at first, as if I wasn't supposed to look behind the curtain, then realized another selling feature: "Well, sure, you could even add more tools to the GUI!" and after a pause, added "if you have them". Sure, I have them all right. He gave me a path to start looking under, and after a bit of searching I found the directory with all the tools he had been demoing.
The tools all had familiar names. One was even called socketsnoop.d. A new possibility dawned on me.
No way.
I printed socketsnoop.d. The screen filled with my own script. It was the same incomplete attempt I had hacked up a year earlier, and published as open source. It included some weird code that only made sense when I wrote it (use of PFORMAT, prior to defaultargs) and was written in my earlier coding style. I was looking at my own fucking script.
"This is MY script."
I printed the other tools and saw the same – they were all mine. This hot new Sun product that Mr. VIP was touring the world showing off was actually just my own open source tools.
My jaw was on the floor. He didn't seem to believe me.
You Can't Do That
I used grep to search all his tools for my name, which was in the header comment of all my tools, to prove beyond a doubt that these were mine. But I found nothing. My name had been stripped.
Some of my tools had even included the line:
# Author: Brendan Gregg [Sydney, Australia]
And now, here he was, in Sydney, Australia, trying to sell Brendan Gregg's tools to Brendan Gregg.
One of the Australian Sun staff interrupted: "Those say copyright Sun Microsystems." Most of my tools had my own copyright and a GPLv2 or CDDL license. But these only had Sun's standard copyright message, and the open source licenses had been stripped.
"You deleted my name! And the copyrights and licenses!"
The other Aussie added, to the VIP: "You can't do that." A silence fell over the room as the magnitude of what had happened sunk in. While some at Sun were encouraging open source contributions and building a community, others were ripping off that same community. Taking their work, changing the licence and copyrights, and then selling it.
The VIP wasn't prepared for this and had a look of confusion. He didn't say much, other than that he didn't know what had happened, and that he may have gotten the tools from someone else already like this (ie, don't blame me). He seemed to be only half believing what we were saying.
The meeting ended quickly. I suggested that he get newer copies of my tools, directly from the DTraceToolkit, since these older versions from my homepage were out of date, and some had errors that I had already fixed. I also reminded him to keep my name, copyright, and license on all of them.
In his defense, perhaps the meeting may have gone differently had I not been given a low-key Australian introduction. That's an Australian cultural problem (tall poppy syndrome). To an Australian, introductions in the US can sound boastful, but they can also be useful as a quick way to share one's specialties.
Other Cases
Of all the tools I had published as open source, I still can't believe socketsnoop.d was included. It wasn't even very good. Later on I wrote much better socket tools (in my DTrace and BPF books).
A few years later, Apple added dozens of my tools to OS X. They left my name, copyright, and CDDL open source license intact, and even improved and enhanced some of them. Years later, Oracle did the same for Oracle Solaris 11, and the BSD community did for FreeBSD. My thanks to all of you.
You might say that this wasn't really Sun the company doing this, but rather, a careless individual. But there was something in Sun's culture that contributed to this kind of carelessness. It was something I and my consulting colleagues had run into before: The belief at Sun that only Sun could make good use of its own technologies, and anything created outside of Sun was trash. When these Sun employees found something that was good, they were inclined to assume it came from Sun, and it was therefore safe to reuse and rebrand (and relicense) as they assumed they already held the copyrights.
There were also others at Sun that did try hard to do the right thing by me and my work. On at least four other occasions my DTraceToolkit was built into observability products, without stripping licenses. (In one case they wanted to relicense to GPL, and talked to me and Sun legal about it, but that's another story.)
This also wasn't the last time someone unwittingly tried to sell me my own work, it was just the first. I've learned to not tell sales people that I invented what they are showing me, as they then give me funny looks like I'm a crazy person, but instead to simply say "I have a lot of experience with that technology" and leave it at that.
I'm reminded of this first case since my BPF tools are now appearing in observability products, and will grow to a scale much bigger than my DTrace tools. I'll write about it more in future posts, but my immediate advice to developers is this: Please try to build upon my BPF tools and the bcc libraries (either bcc Python or bcc libbpf-tool versions) instead of rewriting them, and fetch regular updates. This is because they are works-in-progress, and rewriting (forking) them divides engineering resources and may have your customers using out of date versions. I explain in more detail in How To Add eBPF Observability To Your Product. Note that I think my flame graph software is different: Since it is a simple and finished algorithm that doesn't need much maintenance, I don't see a big problem with people rewriting it. (It is nice to get some thanks, however, just as I have done for those that inspired flame graphs.)
As for the unbelievable demo: This wasn't the great DTrace product I imagined when hearing about a world tour. It was, in fact, my own tools. I suspect that it's not uncommon for an open source developer to discover, at some point, that their own code has been rebranded. But the circumstance in this case may be a little unusual. A US developer got a world tour for software he didn't write, which included giving a sales pitch and demo in Australia, unwittingly, to the author. I don't think he even said thank you.
Click here for Disqus comments (ad supported).